Question:
Refer to the information in Problem 20-51 for the Davidson Yachts Company.
Required
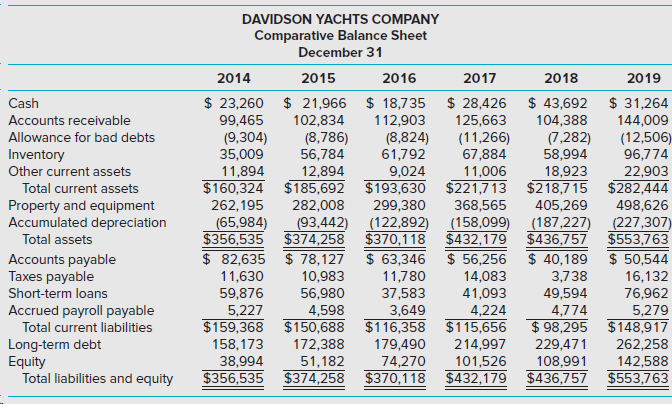
1. What is the valuation of Davidson Yachts Company using the book value of equity method?
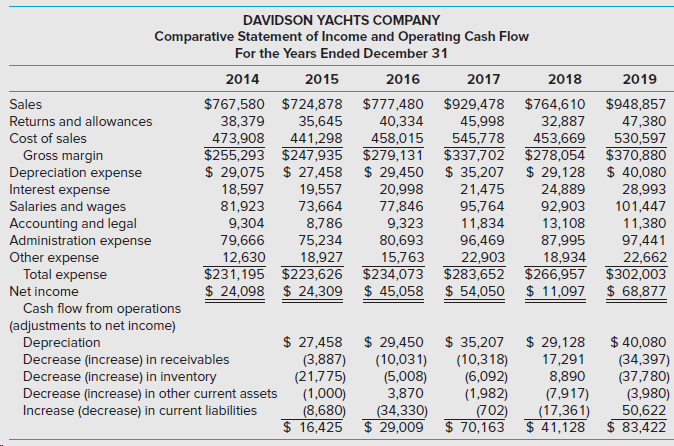
2. What is the valuation of Davidson Yachts Company using the multiples-based method on earnings? Assume the industry average earnings multiple is 7. Use the median value of the most recent 3 years for earnings.
3. What is the valuation of Davidson Yachts Company using the mulitples-based method on operating cash flow? Assume the industry average multiple on operating cash flow is 5. Use the median value of the most recent 3 years for cash flow.
4. Compare and discuss the three valuations. Which of the methods would you use? Why?
Transcribed Image Text:
DAVIDSON YACHTS COMPANY Comparative Balance Sheet December 31 2017 2014 2015 2016 2018 2019 $ 23,260 $ 21,966 $ 18,735 $ 28,426 $ 43,692 $ 31,264 Cash Accounts receivable 99,465 102,834 112,903 125,663 104,388 144,009 (12,506) 96,774 (8,786) 56,784 12,894 $160,324 $185,692 $193,630 Allowance for bad debts (9,304) 35,009 11,894 (8,824) 61,792 9,024 (11,266) 67,884 11,006 $221,713 (7,282) 58,994 Inventory Other current assets 18,923 22,903 $282,444 $218,7 15 405,269 Total current assets Property and equipment Accumulated depreciation 262,195 282,008 299,380 368,565 498,626 (227,307) $553,763 $ 50,544 16,132 (65,984) $356,535 $ 82,635 11,630 59,876 5,227 $159,368 $150,688 $116,358 (93,442) (122,892) $374,258 $370,118 $ 78,127 (158,099) $432,179 $ 56,256 (187,227) $436,757 $ 40,189 Total assets $ 63,346 11,780 Accounts payable Taxes payable 10,983 14,083 3,738 37,583 3,649 49,594 Short-term loans 56,980 41,093 76,962 Accrued payroll payable 5,279 $148,917 4,598 4,224 4,774 $115,656 $ 98,295 Total current liabilities 172,388 Long-term debt Equity Total liabilities and equity 158,173 179,490 214,997 229,471 262,258 38,994 $356,535 74,270 $370,118 51,182 101,526 108,991 $436,757 142,588 $374,258 $432,179 $553,763 DAVIDSON YACHTS COMPANY Comparative Statement of Income and Operating Cash Flow For the Years Ended December 31 2014 2015 2016 2017 2018 2019 $767,580 $724,878 35,645 $777,480 $929,478 $764,610 $948,857 47,380 530,597 $370,880 $ 40,080 Sales Returns and allowances 38,379 40,334 45,998 32,887 473,908 $255,293 $247,935 $ 29,075 $ 27,458 18,597 Cost of sales 441,298 458,015 $279,131 $337,702 $ 29,450 545,778 Gross margin Depreciation expense Interest expense Salaries and wages Accounting and legal Administration expense 453,669 $278,054 $ 29,128 24,889 92,903 $ 35,207 19,557 20,998 21,475 28,993 81,923 73,664 77,846 95,764 101,447 9,304 79,666 12,630 $231,195 $223,626 $ 24,098 $ 24,309 8,786 9,323 80,693 15,763 $234,073 $283,652 $266,957 $ 45,058 11,380 11,834 96,469 13,108 87,995 75,234 97,441 Other expense Total expense 18,927 22,903 18,934 22,662 $302,003 $ 68,877 Net income $ 54,050 $ 11,097 Cash flow from operations (adjustments to net income) Depreciation Decrease (increase) in receivables Decrease (increase) in inventory Decrease (increase) in other current assets Increase (decrease) in current liabilities $ 27,458 (3,887) (21,775) (1,000) (8,680) $ 16,425 $ 29,450 (10,031) (5,008) 3,870 $ 35,207 (10,318) (6,092) (1,982) (702) $ 70,163 $ 29,128 17,291 8,890 (7,917) (17,361) $ 41,128 $ 40,080 (34,397) (37,780) (3,980) 50,622 $ 83,422 (34,330) $ 29,009