

Question: In each of the following problems, determine the best function y(x) (linear, exponential, or power function) to describe the data. Plot the function on the
In each of the following problems, determine the best function y(x) (linear, exponential, or power function) to describe the data. Plot the function on the same plot with the data. Label and format the plots appropriately.
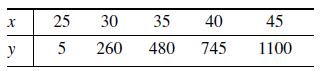
a.
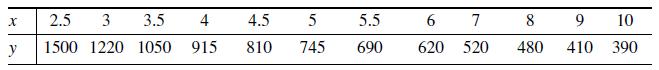
b.
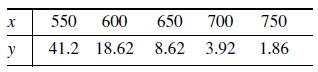
c.
25 30 35 40 45 y 260 480 745 1100
Step by Step Solution
★★★★★
3.40 Rating (159 Votes )
There are 3 Steps involved in it
1 Expert Approved Answer
Step: 1 Unlock

To determine the best function to describe the data and plot the function along with the data we nee... View full answer
Question Has Been Solved by an Expert!
Get step-by-step solutions from verified subject matter experts
Step: 2 Unlock
Step: 3 Unlock