

Question: Consider the ratio control algorithm experiment described in Chapter 3, Section 3.8. The experiment was actually conducted as a randomized block design, where six time
Consider the ratio control algorithm experiment described in Chapter 3, Section 3.8. The experiment was actually conducted as a randomized block design, where six time periods were selected as the blocks, and all four ratio control algorithms were tested in each time period. The average cell voltage and the standard deviation of voltage (shown in parentheses) for each cell are as follows:
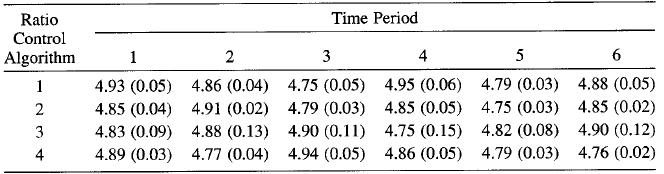
(a) Analyze the average cell voltage data. (Use α = 0.05.) Does the choice of ratio control algorithm affect the average cell voltage?
(b) Perform an appropriate analysis on the standard deviation of voltage. (Recall that this is called "pot noise.") Does the choice of ratio control algorithm affect the pot noise?
(c) Conduct any residual analyses that seem appropriate.
(d) Which ratio control algorithm would you select if your objective is to reduce both the average cell voltage and the pot noise?
Ratio Time Period Control Algorithm 1 2 3 4 5 6 4.93 (0.05) 4.86 (0.04) 4.75 (0.05) 4.95 (0.06) 4.79 (0.03) 4.88 (0.05) 4.85 (0.04) 4.91 (0.02) 4.79 (0.03) 4.85 (0.05) 4.75 (0.03) 4.85 (0.02) 4.83 (0.09) 4.88 (0.13) 4.90 (0.11) 4.75 (0.15) 4.82 (0.08) 4.90 (0.12) 4.89 (0.03) 4.77 (0.04) 4.94 (0.05) 4.86 (0.05) 4.79 (0.03) 4.76 (0.02) 1 3 4
Step by Step Solution
3.36 Rating (165 Votes )
There are 3 Steps involved in it
a Analyze the Average Cell Voltage Data To determine if the choice of ratio control algorithm affects the average cell voltage we use a twoway ANOVA w... View full answer

Get step-by-step solutions from verified subject matter experts