

Reconsider part (c) of Problem 6-1. Use the regression model to generate response surface and contour plots
Question:
Reconsider part (c) of Problem 6-1. Use the regression model to generate response surface and contour plots of the tool life response. Interpret these plots. Do they provide insight regarding the desirable operating conditions for this process?
Problem 6-1.
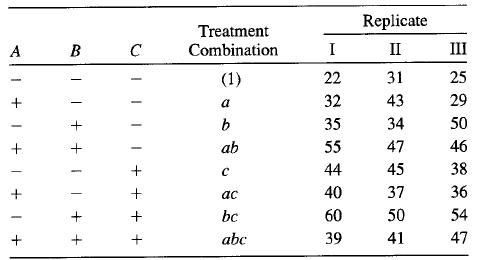
An engineer is interested in the effects of cutting speed (A), tool geometry (B), and cutting angle (C) on the life (in hours) of a machine tool. Two levels of each factor are chosen, and three replicates of a 23 factorial design are run. The results follow:
(c) Write down a regression model for predicting tool life (in hours) based on the results of this experiment.
Fantastic news! We've Found the answer you've been seeking!
Step by Step Answer:
o generate response surface and contour plots of the tool life response we first need to create a re...View the full answer

Answered By
Dulal Roy
As a tutor, I have gained extensive hands-on experience working with students one-on-one and in small group settings. I have developed the ability to effectively assess my students' strengths and weaknesses, and to customize my teaching approach to meet their individual needs.
I am proficient at breaking down complex concepts into simpler, more digestible pieces, and at using a variety of teaching methods (such as visual aids, examples, and interactive exercises) to engage my students and help them understand and retain the material.
I have also gained a lot of experience in providing feedback and guidance to my students, helping them to develop their problem-solving skills and to become more independent learners. Overall, my hands-on experience as a tutor has given me a deep understanding of how to effectively support and encourage students in their learning journey.
0 Reviews
10+ Question Solved
Related Book For 

Question Posted:
