

Use the regression model in part (c) of Problem 6-23 to generate a response surface contour plot
Question:
Use the regression model in part (c) of Problem 6-23 to generate a response surface contour plot of yield. Discuss the practical value of this response surface plot.
Problem 6-23
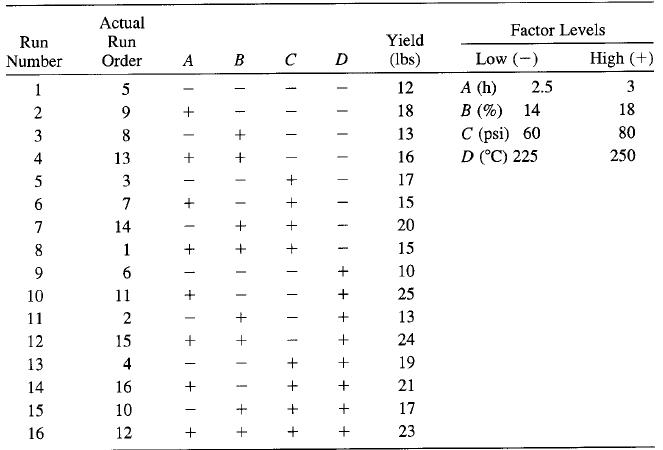
In a process development study on yield, four factors were studied, each at two levels: time (A), concentration (B), pressure (C), and temperature (D). A single replicate of a 24 design was run, and the resulting data are shown in the following table:
(c) Write down a regression model relating yield to the important process variables.
Step by Step Answer:

This question has not been answered yet.
You can Ask your question!
Related Book For 

Question Posted:
