

Question: SM charts for two linked state machines are shown here. Machine T starts in state T 0 , and machine S starts in state S
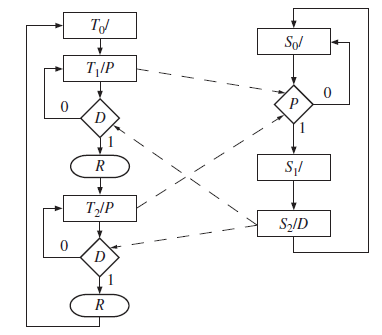
SM charts for two linked state machines are shown here. Machine T starts in state T0, and machine S starts in state S0. Draw a timing chart that shows CLK, the states of T and S, and signals P, R, and D for 10 clocks. All state changes occur on the rising edge of the clock.
TJ Sol T,IP 1. S/ T/P SID
Step by Step Solution
★★★★★
3.51 Rating (154 Votes )
There are 3 Steps involved in it
1 Expert Approved Answer
Step: 1 Unlock

CLK TPRSO ... View full answer
Question Has Been Solved by an Expert!
Get step-by-step solutions from verified subject matter experts
Step: 2 Unlock
Step: 3 Unlock