

Question: Using the zhang_sample.sav data from Chapter 4 (Task 8) plot a clustered error bar chart of the mean test accuracy as a function of the
Using the zhang_sample.sav data from Chapter 4 (Task 8) plot a clustered error bar chart of the mean test accuracy as a function of the type of name participants completed the test under (x-axis) and whether they identified as male or female (different coloured bars).
Chapter 4 Task 8
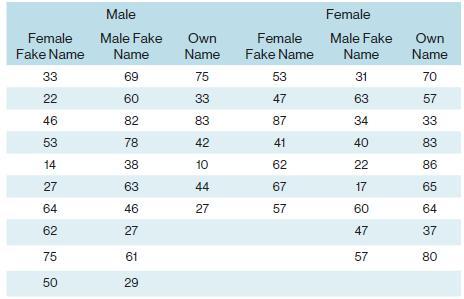
were given a booklet that already had either a male or female name on. Participants in the latter two conditions were told that they would use this other person’s name for the purpose of the test. Women who completed the test using a different name performed better than those who completed the test using their own name. (There were no such effects for men.) The data below are a random subsample of Zhang et al.’s data. Enter them into SPSS and save the file as zhang_sample.sav
Male Female Female Male Fake Own Female Male Fake Own Fake Name Name Name Fake Name Name Name 33 69 75 53 31 70 22 60 33 47 83 63 57 46 82 83 87 34 33 53 78 42 41 40 83 14 38 10 62 22 86 27 63 44 67 17 65 64 46 27 57 60 64 62 27 47 37 75 61 57 80 50 29
Step by Step Solution
There are 3 Steps involved in it

Get step-by-step solutions from verified subject matter experts