

Question: Using the teach_method.sav data from Chapter 4 (Task 3), plot a clustered error line chart of the mean score when electric shocks were used compared
Using the teach_method.sav data from Chapter 4 (Task 3), plot a clustered error line chart of the mean score when electric shocks were used compared to being nice, and plot males and females as different coloured lines.
Chapter 4 Task 3
The data below show the score (out of 20) for 20 different students, some of whom are male and some female, and some of whom were taught using positive reinforcement (being nice) and others who were taught using punishment (electric shock). Enter these data into SPSS and save the file as teach_method.sav.
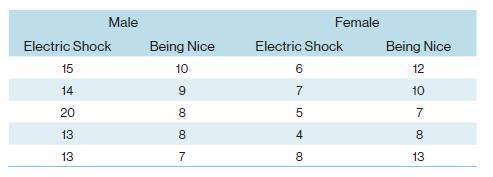
Electric Shock Male Female Being Nice Electric Shock Being Nice 15 10 6 12 14 9 7 20 8 5 10 7 13 8 4 8 13 7 00 8 13
Step by Step Solution
There are 3 Steps involved in it

Get step-by-step solutions from verified subject matter experts