

(a) Use a histogram to graph the empirical distribution of the duration times between American Airline trades....
Question:
(a) Use a histogram to graph the empirical distribution of the duration times between American Airline trades. Compare the graph with Figure 2.9.
Figure 2.9.
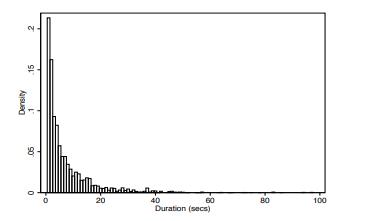
(b) Interpret the shape of the distribution of durations times.
Step by Step Answer:

This question has not been answered yet.
You can Ask your question!
Related Book For 

Financial Econometric Modeling
ISBN: 9781633844605
1st Edition
Authors: Stan Hurn, Vance L. Martin, Jun Yu, Peter C.B. Phillips
Question Posted:
