

Following table gives annual data on the Consumer Price Index (CPI) and the Wholesale Price Index (WPI),
Question:
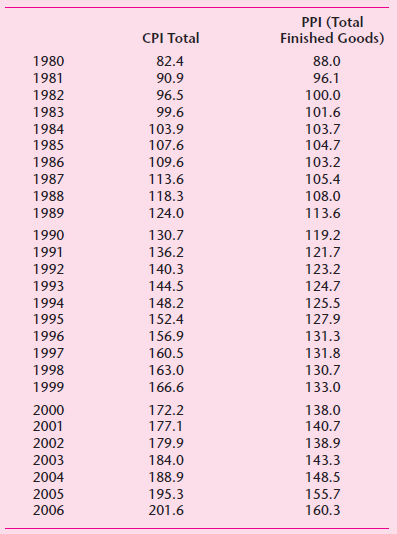
a. Plot the CPI on the vertical axis and the WPI on the horizontal axis. A priori, what kind of relationship do you expect between the two indexes? Why?
b. Suppose you want to predict one of these indexes on the basis of the other index. Which will you use as the regressand and which as the regressor? Why?
c. Run the regression you have decided in (b). Show the standard output. Test the hypothesis that there is a one-to-one relationship between the two indexes.
d. From the residuals obtained from the regression in (c), can you entertain the hypothesis that the true error term is normally distributed? Show the tests you use.
Fantastic news! We've Found the answer you've been seeking!
Step by Step Answer:
a The scattergram as well is shown in the above figure b Treat CPI as the regressand and WPI as the ...View the full answer

Answered By
Nimlord Kingori
2023 is my 7th year in academic writing, I have grown to be that tutor who will help raise your grade and better your GPA. At a fraction of the cost on other sites, I will work on your assignment by taking it as mine. I give it all the attention it deserves and ensures you get the grade that I promise. I am well versed in business-related subjects, information technology, Nursing, history, poetry, and statistics. Some software's that I have access to are SPSS and NVIVO. I kindly encourage you to try me; I may be all that you have been seeking, thank you.
360+ Reviews
1070+ Question Solved
Related Book For 

Question Posted:
