

Question: The following table provides data on the lung cancer mortality index (100 = average) and the smoking index (100 = average) for 25 occupational groups.
a. Plot the cancer mortality index against the smoking index. What general pattern do you observe?
b. Letting Y = cancer mortality index and X = smoking index, estimate a linear regression model and obtain the usual regression statistics.
c. Test the hypothesis that smoking has no influence on lung cancer at α = 5%.
d. Which are the risky occupations in terms of lung cancer mortality? Can you give some reasons why this might be so?
e. Is there any way to bring occupation category explicitly into the regression analysis?
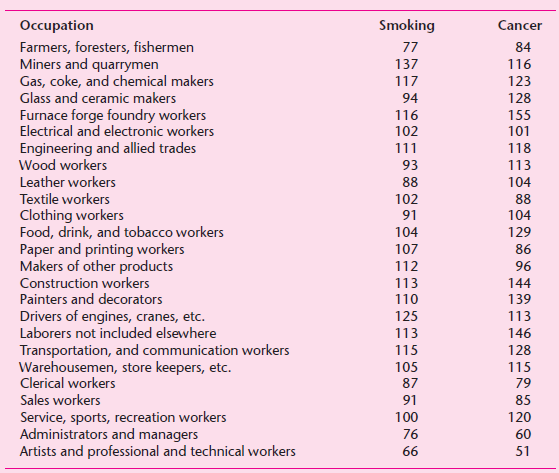
Smoking Occupation Cancer Farmers, foresters, fishermen Miners and quarrymen Gas, coke, and chemical makers 77 84 137 116 117 123 Glass and ceramic makers 94 128 Furnace forge foundry workers Electrical and electronic workers Engineering and allied trades Wood workers 116 155 102 101 111 118 93 113 Leather workers 88 104 Textile workers Clothing workers Food, drink, and tobacco workers Paper and printing workers Makers of other products Construction workers 102 88 91 104 104 129 107 86 96 112 113 110 144 Painters and decorators 139 Drivers of engines, cranes, etc. Laborers not included elsewhere 125 113 113 146 Transportation, and communication workers Warehousemen, store keepers, etc. Clerical workers 115 128 105 115 87 79 Sales workers 91 85 Service, sports, recreation workers Administrators and managers Artists and professional and technical workers 100 120 76 60 66 51
Step by Step Solution
3.43 Rating (166 Votes )
There are 3 Steps involved in it
a There seems to be a general positive relationship between Smoking and Morta... View full answer

Get step-by-step solutions from verified subject matter experts
Document Format (2 attachments)
1529_605d88e1ccbaa_656197.pdf
180 KBs PDF File
1529_605d88e1ccbaa_656197.docx
120 KBs Word File