

Question: From the annual data for the U.S. manufacturing sector for 18991922, Dougherty obtained the following regression results: where Y = index of real output, K
From the annual data for the U.S. manufacturing sector for 1899€“1922, Dougherty obtained the following regression results:
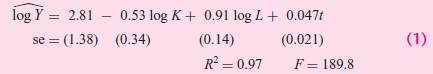
where Y = index of real output, K = index of real capital input, L = index of real labor input, t = time or trend.
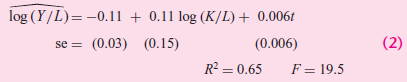
Using the same data, he also obtained the following regression:
a. Is there multicollinearity in regression (1)? How do you know?
b. In regression (1), what is the a priori sign of log K? Do the results conform to this expectation? Why or why not?
c. How would you justify the functional form of regression (1)?
d. Interpret regression (1). What is the role of the trend variable in this regression?
e. What is the logic behind estimating regression (2)?
f. If there was multicollinearity in regression (1), has that been reduced by regression (2)? How do you know?
g. If regression (2) is a restricted version of regression (1), what restriction is imposed by the author? How do you know if this restriction is valid? Which test do you use? Show all your calculations.
h. Are the R2 values of the two regressions comparable? Why or why not? How would you make them comparable, if they are not comparable in the present form?
log = 2.81 0.53 log K+ 0.91 log L+ 0.047t (0.14) R = 0.97 %3D (0.34) se = (1.38) (0.021) F = 189.8 (1) se = log (Y/L)= -0.ll + 0.11 log (K/L)+ 0.006t (0.006) R = 0.65 (0.03) (0.15) (2) se = F = 19.5
Step by Step Solution
3.49 Rating (169 Votes )
There are 3 Steps involved in it
a Given the relatively high R 2 of 097 the significant F value and the economically speaking imprope... View full answer

Get step-by-step solutions from verified subject matter experts
Document Format (2 attachments)
1529_605d88e1d44da_656796.pdf
180 KBs PDF File
1529_605d88e1d44da_656796.docx
120 KBs Word File