

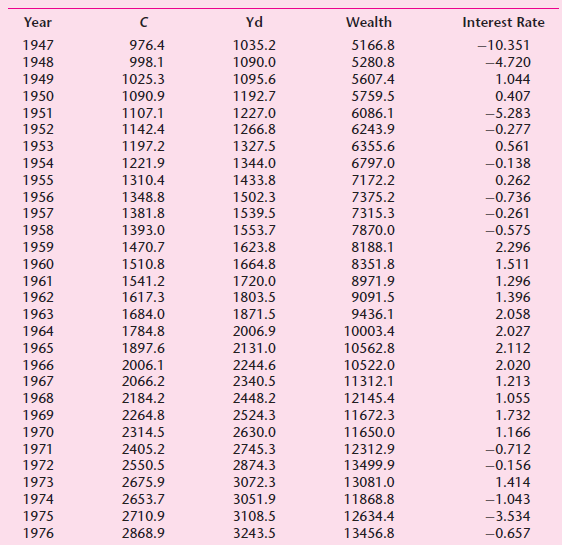
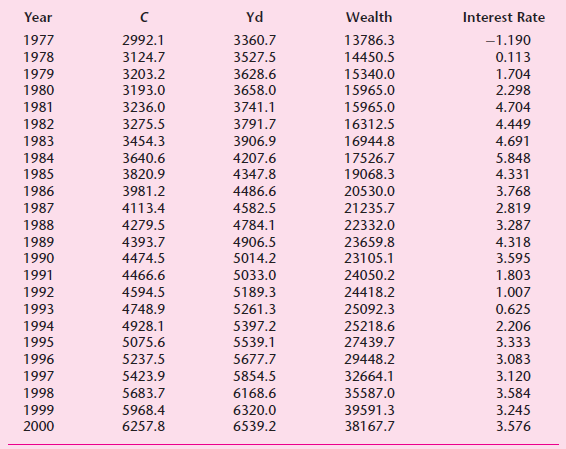
Question: Refer to Exercise 7.24 and the data in the following table concerning four economic variables in the U.S. from 19472000. a. Based on the regression
a. Based on the regression of consumption expenditure on real income, real wealth and real interest rate, find out which of the regression coefficients are individually statistically significant at the 5 percent level of significance. Are the signs of the estimated coefficients in accord with economic theory?
b. Based on the results in (a), how would you estimate the income, wealth, and interest rate elasticities? What additional information, if any, do you need to compute the elasticities?
c. How would you test the hypothesis that the income and wealth elasticities are the same? Show the necessary calculations.
d. Suppose instead of the linear consumption function estimated in (a), you regress the logarithm of consumption expenditure on the logarithms of income and wealth and the interest rate. Show the regression results. How would you interpret the results?
e. What are the income and wealth elasticities estimated in (d)? How would you interpret the coefficient of the interest rate estimated in (d)?
f. In the regression in (d) could you have used the logarithm of the interest rate instead of the interest rate? Why or why not?
g. How would you compare the elasticities estimated in (b) and in (d)?
h. Between the regression models estimated in (a) and (d ), which would you prefer? Why?
i. Suppose instead of estimating the model given in (d ), you only regress the logarithm of consumption expenditure on the logarithm of income. How would you decide if it is worth adding the logarithm of wealth in the model? And how would you decide if it is worth adding both the logarithm of wealth and interest rate variables in the model? Show the necessary calculations.
Yd Wealth Year Interest Rate 1947 976.4 1035.2 5166.8 -10.351 5280.8 1948 998.1 1090.0 -4.720 1095.6 1949 1025.3 5607.4 1.044 1950 1090.9 1192.7 5759.5 0.407 1951 1107.1 1227.0 6086.1 -5.283 1142.4 6243.9 -0.277 1952 1266.8 1953 1197.2 1327.5 6355.6 0.561 1344.0 1954 1221.9 6797.0 -0.138 0.262 1955 1310.4 1433.8 7172.2 1348.8 7375.2 7315.3 1956 1502.3 -0.736 1957 1381.8 1539.5 -0.261 1553.7 1958 1393.0 7870.0 -0.575 8188.1 1959 1470.7 1623.8 2.296 1.511 1.296 1960 1510.8 1664.8 8351.8 1961 1541.2 1617.3 1720.0 8971.9 1962 1803.5 1871.5 9091.5 1.396 1963 1684.0 9436.1 2.058 10003.4 1964 1784.8 2006.9 2.027 2.112 1965 1897.6 2131.0 10562.8 1966 2006.1 2244.6 10522.0 2.020 1.213 1967 2066.2 2340.5 11312.1 1968 2184.2 2448.2 12145.4 1.055 2524.3 1969 2264.8 11672.3 1.732 1970 2314.5 2630.0 11650.0 1.166 1971 2405.2 2745.3 12312.9 -0.712 1972 2550.5 2874.3 13499.9 -0.156 1973 2675.9 3072.3 13081.0 1.414 11868.8 1974 2653.7 3051.9 -1.043 1975 2710.9 3108.5 12634.4 -3.534 13456.8 1976 2868.9 3243.5 -0.657 Year Yd Wealth Interest Rate 1977 2992.1 3360.7 13786.3 -1.190 1978 3124.7 3527.5 14450.5 0.113 1979 3203.2 3628.6 15340.0 1.704 1980 3193.0 3658.0 15965.0 2.298 1981 3236.0 3741.1 15965.0 4.704 1982 3275.5 3791.7 16312.5 4.449 1983 3454.3 3906.9 16944.8 4.691 1984 3640.6 4207.6 17526.7 5.848 1985 3820.9 4347.8 19068.3 4.331 1986 3981.2 4486.6 20530.0 3.768 1987 4113.4 4582.5 21235.7 2.819 1988 4279.5 4784.1 22332.0 3.287 1989 4393.7 4906.5 23659.8 4.318 1990 4474.5 5014.2 23105.1 3.595 1991 4466.6 5033.0 24050.2 1.803 1992 4594.5 5189.3 24418.2 1.007 1993 4748.9 5261.3 25092.3 0.625 1994 4928.1 5397.2 25218.6 2.206 3.333 1995 5075.6 5539.1 27439.7 1996 5237.5 5677.7 29448.2 3.083 1997 5423.9 5854.5 32664.1 3.120 1998 5683.7 6168.6 35587.0 3.584 1999 5968.4 6320.0 39591.3 3.245 2000 6257.8 6539.2 38167.7 3.576
Step by Step Solution
3.13 Rating (166 Votes )
There are 3 Steps involved in it
a The results of the linear model are reproduced below C t 206327 07340Y d 00360Wealth 55212 Interest t 16085 533762 144882 23067 R 2 09994 The three ... View full answer

Get step-by-step solutions from verified subject matter experts
Document Format (2 attachments)
1529_605d88e1ce88d_656275.pdf
180 KBs PDF File
1529_605d88e1ce88d_656275.docx
120 KBs Word File