

Refer to Section 8.8 and the data in the following table concerning disposable personal income and personal
Question:
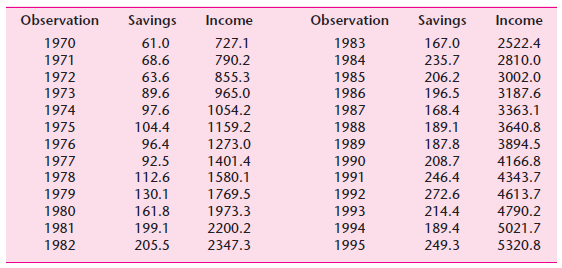
According to the National Bureau of Economic Research, the most recent U.S. business contraction cycle ended in late 2001. Split the data into three sections:
(1) 1970€“1981, (2) 1982€“2001, and (3) 2002€“2005.
a. Estimate both the model for the full dataset (years 1970€“2005) and the third section (post-2002). Using the Chow test, determine if there is a significant break between the third period and the full dataset.
b. With this new data in Table 8.11, determine if there is still a significant difference between the first set of years (1970€“1981) and the full dataset, now that there are more observations available.
c. Perform the Chow test on the middle period (1982€“2001) versus the full dataset to see if the data in this period behave significantly differently than the rest of the data.
Step by Step Answer:
a The results of the full dataset model are as follows Sav t 1848291 00037 Income t t 6625 0627 R 2 ...View the full answer


