Question:
Refer to Table 8.3.
a. A researcher suspects that the effect of \% Eligible for subsidized lunch has a nonlinear effect on test scores. In particular, he conjectures that increases in this variable from \(10 \%\) to \(20 \%\) have little effect on test scores but that changes from \(50 \%\) to \(60 \%\) have a much larger effect.
i. Describe a nonlinear specification that can be used to model this form of nonlinearity.
ii. How would you test whether the researcher's conjecture was better than the linear specification in column (7) of Table 8.3?
b. A researcher suspects that the effect of income on test scores is different in districts with small classes than in districts with large classes.
i. Describe a nonlinear specification that can be used to model this form of nonlinearity.
ii. How would you test whether the researcher's conjecture was better than the linear specification in column (7) of Table 8.3?
Table 8.3
Transcribed Image Text:
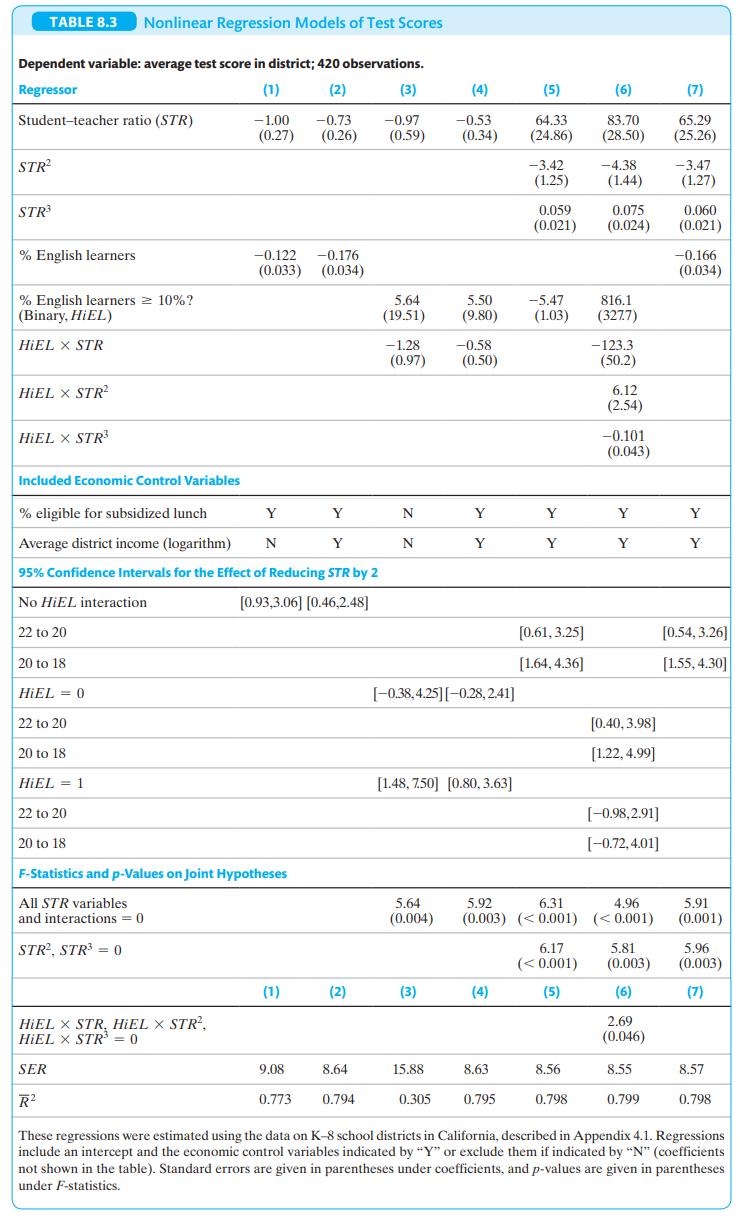
TABLE 8.3 Nonlinear Regression Models of Test Scores Dependent variable: average test score in district; 420 observations. Regressor (1) (2) (3) (4) (5) (6) (7) Student-teacher ratio (STR) -1.00 -0.73 -0.97 -0.53 64.33 83.70 65.29 (0.27) (0.26) (0.59) (0.34) (24.86) (28.50) (25.26) STR -3.42 -4.38 -3.47 (1.25) (1.44) (1.27) STR 0.059 0.075 0.060 (0.021) (0.024) (0.021) % English learners % English learners 10%? -0.122 -0.176 -0.166 (0.033) (0.034) (0.034) 5.64 5.50 -5.47 816.1 (Binary, HiEL) HiEL X STR (19.51) (9.80) (1.03) (327.7) -1.28 -0.58 -123.3 (0.97) (0.50) HIEL STR (50.2) 6.12 (2.54) -0.101 HIEL X STR Included Economic Control Variables % eligible for subsidized lunch Average district income (logarithm) (0.043) Y Y N Y Y Y Y N Y N Y Y Y Y 95% Confidence Intervals for the Effect of Reducing STR by 2 No HiEL interaction 22 to 20 20 to 18 HIEL = 0 22 to 20 20 to 18 HIEL = 1 22 to 20 [0.93,3.06] [0.46,2.48] 20 to 18 F-Statistics and p-Values on Joint Hypotheses All STR variables [0.61, 3.25] [0.54, 3.26] [1.64, 4.36] [1.55, 4.30] [-0.38,4.25][-0.28, 2.41] [0.40, 3.98] [1.22,4.99] [1.48, 7.50] [0.80, 3.63] [-0.98,2.91] [-0.72,4.01] and interactions = 0 STR, STR3 = 0 5.64 (0.004) 5.92 6.31 4.96 5.91 (0.003) ( <0.001) ( <0.001) (0.001) 6.17 ( <0.001) 5.81 5.96 (0.003) (0.003) (1) (2) (3) (4) (5) (6) (7) HIEL X STR, HIEL X STR, 2.69 HiEL STR = 0 (0.046) SER 9.08 8.64 0.773 0.794 R These regressions were estimated using the data on K-8 school districts in California, described in Appendix 4.1. Regressions include an intercept and the economic control variables indicated by "Y" or exclude them if indicated by "N" (coefficients not shown in the table). Standard errors are given in parentheses under coefficients, and p-values are given in parentheses under F-statistics. 15.88 8.63 8.56 8.55 8.57 0.305 0.795 0.798 0.799 0.798