

Question: Use the investment data given in the following table. a. Estimate the Grunfeld investment function for each company individually. b. Now pool the data for
Use the investment data given in the following table.
a. Estimate the Grunfeld investment function for each company individually.
b. Now pool the data for all the companies and estimate the Grunfeld investment function by OLS.
c. Use LSDV to estimate the investment function and compare your results with the pooled regression estimated in (b).
d. How would you decide between the pooled regression and the LSDV regression? Show the necessary calculations.
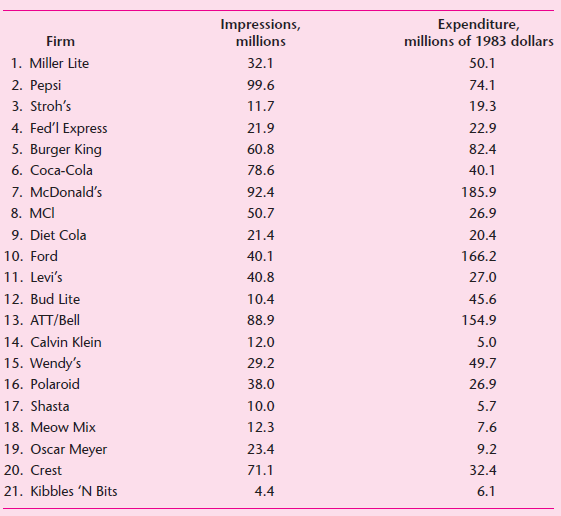
Expenditure, millions of 1983 dollars Impressions, millions Firm 1. Miller Lite 32.1 50.1 2. Pepsi 99.6 74.1 3. Stroh's 11.7 19.3 4. Fed'l Express 21.9 22.9 5. Burger King 60.8 82.4 6. Coca-Cola 78.6 40.1 7. McDonald's 92.4 185.9 8. MCI 50.7 26.9 9. Diet Cola 21.4 20.4 10. Ford 166.2 40.1 11. Levi's 40.8 27.0 12. Bud Lite 10.4 45.6 13. ATT/Bell 88.9 154.9 14. Calvin Klein 12.0 5.0 15. Wendy's 29.2 49.7 16. Polaroid 38.0 26.9 17. Shasta 10.0 5.7 18. Meow Mix 12.3 7.6 19. Oscar Meyer 23.4 9.2 20. Crest 71.1 32.4 Kibbles 'N Bits 21. 4.4 6.1
Step by Step Solution
3.22 Rating (160 Votes )
There are 3 Steps involved in it
a A priori one would expect an inverse relationship between the two because if unemployment is high ... View full answer

Get step-by-step solutions from verified subject matter experts
Document Format (2 attachments)
1529_605d88e1db790_666460.pdf
180 KBs PDF File
1529_605d88e1db790_666460.docx
120 KBs Word File