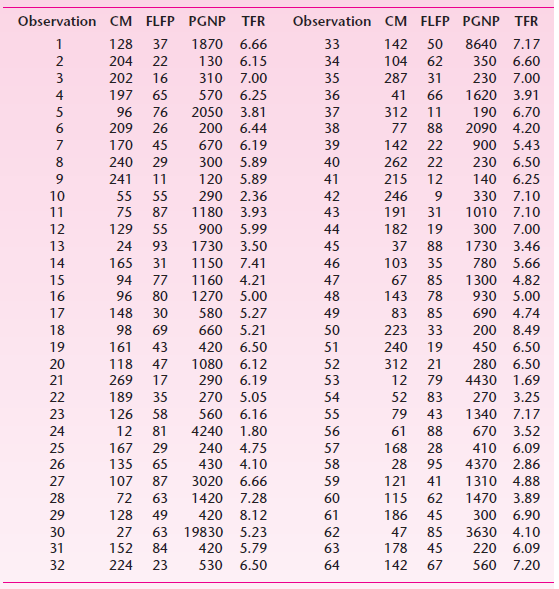
Question: Return to the child mortality example that we have discussed several times. In regression (7.6.2) we regressed child mortality (CM) on per capita GNP (PGNP)
a. How would you interpret the coefficient of TFR? A priori, would you expect a positive or negative relationship between CM and TFR? Justify your answer.
b. Have the coefficient values of PGNP and FR changed between the two equations? If so, what may be the reason(s) for such a change? Is the observed difference statistically significant? Which test do you use and why?
c. How would you choose between models 1 and 2? Which statistical test would you use to answer this question? Show the necessary calculations.
d. We have not given the standard error of the coefficient of TFR. Can you find it out?
Observation CM FLFP PGNP TFR Observation CM FLFP PGNP TER 128 8640 1 37 1870 6.66 33 142 50 7.17 130 6.15 204 22 34 104 62 350 6.60 202 3 16 310 7.00 35 287 31 230 7.00 197 65 570 6.25 36 41 66 1620 3.91 190 6.70 2090 4.20 96 76 2050 3.81 37 312 11 200 670 88 142 209 26 6.44 38 77 170 45 6.19 39 22 900 5.43 240 29 300 5.89 40 262 22 230 6.50 241 11 120 5.89 41 215 12 140 6.25 290 2.36 10 55 55 42 246 330 7.10 43 191 11 75 87 1180 3.93 31 1010 7.10 12 129 55 900 5.99 44 182 19 300 7.00 1730 3.50 1150 7.41 13 24 93 45 37 88 1730 3.46 14 165 31 46 103 35 780 5.66 15 94 77 1160 4.21 47 67 85 1300 4.82 5.00 5.27 16 96 80 1270 48 143 78 930 5.00 17 148 30 580 49 83 85 690 4.74 660 18 98 69 5.21 50 223 33 200 8.49 19 161 43 420 6.50 51 240 19 450 6.50 20 118 47 1080 6.12 52 312 21 280 6.50 21 269 17 290 6.19 53 12 79 4430 1.69 270 5.05 22 189 35 54 52 83 270 3.25 23 126 58 560 6.16 55 79 43 1340 7.17 670 3.52 24 12 81 4240 1.80 56 61 88 28 95 28 167 25 29 240 4.75 57 168 410 6.09 26 135 65 430 4.10 58 4370 2.86 1310 4.88 27 107 87 3020 6.66 59 121 41 28 72 63 1420 7.28 115 62 1470 3.89 420 29 128 49 8.12 61 186 45 300 6.90 5.23 5.79 27 63 19830 62 47 178 85 3630 4.10 31 152 84 420 63 45 220 6.09 32 224 23 530 6.50 64 142 67 560 7.20 1. CM = 263.6416 0.0056 PGNP; 2.2316 FLR; = (11.5932) (0.0019) (0.2099) R2 = 0.7077 2. M; = 168.3067 - se = (32.8916) (0.0018) 0.0055 PGNP; 1.7680 FLR; + 12.8686TFR; (0.2480) (?) R = 0.7474
Step by Step Solution
3.31 Rating (163 Votes )
There are 3 Steps involved in it
a A priori one would expect a positive relationship between CM and TFR for the larger the number chi... View full answer

Get step-by-step solutions from verified subject matter experts
Document Format (2 attachments)
1529_605d88e1d078c_656463.pdf
180 KBs PDF File
1529_605d88e1d078c_656463.docx
120 KBs Word File


