

Question: The following regressions are based on the CPI data for the United States for the period 1960 2007, for a total of 48 annual observations:
The following regressions are based on the CPI data for the United States for the period 1960 2007, for a total of 48 annual observations:
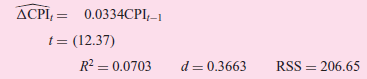
1.
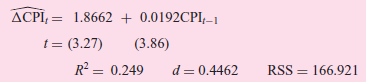
2.
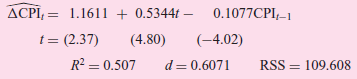
3.
Where
RSS = residual sum of squares.
a. Examining the preceding regressions, what can you say about stationarity of the CPI time series?
b. How would you choose among the three models?
c. Equation (1) is Eq. (3) minus the intercept and trend. Which test would you use to decide if the implied restrictions of model (1) are valid?
0.0334CPI,-1 I, - t = (12.37) d = 0.3663 RSS = 206.65 R = 0.0703 ACP, = 1.8662 + 0.0192CPI,-1 t = (3.27) (3.86) R? = 0.249 d = 0.4462 = 166.921 RSS
Step by Step Solution
3.42 Rating (152 Votes )
There are 3 Steps involved in it
a b The time graph of CPI very much resembles Fig 2112 This graph clearly shows that generally there ... View full answer

Get step-by-step solutions from verified subject matter experts
Document Format (2 attachments)
1529_605d88e1e009c_666603.pdf
180 KBs PDF File
1529_605d88e1e009c_666603.docx
120 KBs Word File