

Question: The following table gives data on the hourly compensation rate in manufacturing in U.S. dollars, Y (%), and the civilian unemployment rate, X (index, 1992
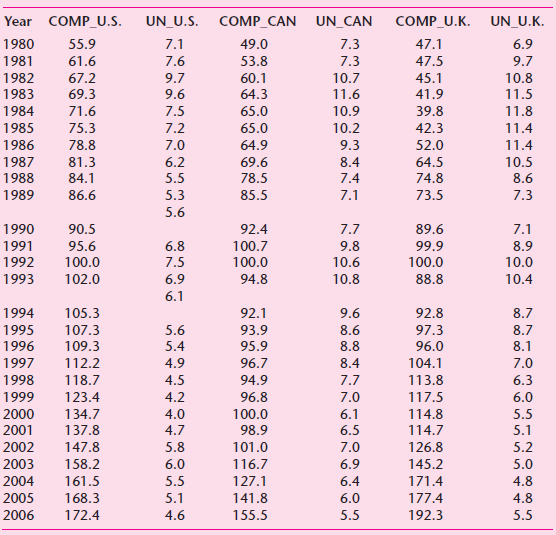
The following table gives data on the hourly compensation rate in manufacturing in U.S. dollars, Y (%), and the civilian unemployment rate, X (index, 1992 = 100), forCanada, the United Kingdom, and the United States for the period 1980?2006.
Consider the model:
Yit = ?1 + ?2Xit + uit ?????. (1)
a. A priori, what is the expected relationship between Y and X? Why?
b. Estimate the model given in Eq. (1) for each country.
c. Estimate the model, pooling all of the 81 observations.
d. Estimate the fixed effects model.
Year COMP_U.S. 1980 55.9 1981 61.6 1982 67.2 1983 69.3 1984 71.6 1985 75.3 1986 78.8 1987 81.3 1988 84.1 1989 86.6 1990 90.5 1991 95.6 1992 100.0 1993 102.0 1994 105.3 1995 107.3 1996 109.3 1997 112.2 1998 118.7 1999 123.4 2000 134.7 2001 137.8 2002 147.8 2003 158.2 2004 161.5 2005 168.3 2006 172.4 UN_U.S. 7.1 7.6 9.7 9.6 7.5 7.2 7.0 6.2 5.5 5.3 5.6 6.8 7.5 6.9 6.1 5.6 5.4 4.9 4.5 4.2 4.0 4.7 5.8 6.0 5.5 5.1 4.6 COMP_CAN UN_CAN COMP_U.K. 49.0 7.3 47.1 53.8 7.3 47.5 60.1 45.1 64.3 41.9 65.0 39.8 65.0 42.3 64.9 52.0 69.6 78.5 85.5 92.4 100.7 100.0 94.8 92.1 93.9 95.9 96.7 94.9 96.8 100.0 98.9 101.0 116.7 127.1 141.8 155.5 10.7 11.6 10.9 10.2 9.3 8.4 7.4 7.1 7.7 9.8 10.6 10.8 9.6 8.6 8.8 8.4 7.7 7.0 6.1 6.5 7.0 6.9 6.4 6.0 5.5 64.5 74.8 73.5 89.6 99.9 100.0 88.8 92.8 97.3 96.0 104.1 113.8 117.5 114.8 114.7 126.8 145.2 171.4 177.4 192.3 UN_U.K. 6.9 9.7 10.8 11.5 11.8 11.4 11.4 10.5 8.6 7.3 7.1 8.9 10.0 10.4 8.7 8.7 8.1 7.0 6.3 6.0 5.5 5.1 5.2 5.0 4.8 4.8 5.5
Step by Step Solution
3.33 Rating (174 Votes )
There are 3 Steps involved in it
a Stata results for the pooled model are b Fixed effects results from Stata ... View full answer

Get step-by-step solutions from verified subject matter experts