

The following table gives data on the hourly compensation rate in manufacturing in U.S. dollars, Y (%),
Question:
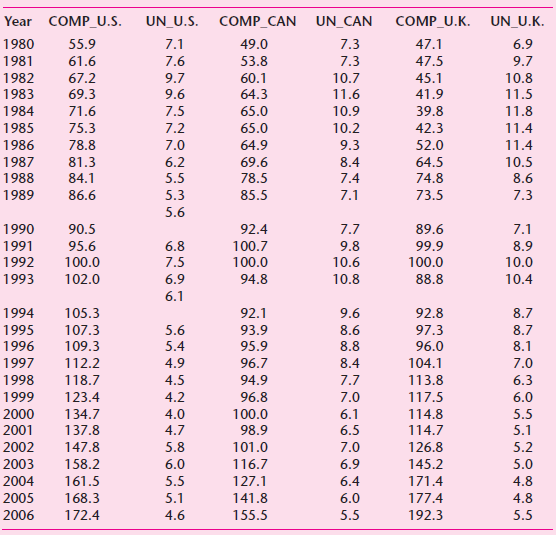
The following table gives data on the hourly compensation rate in manufacturing in U.S. dollars, Y (%), and the civilian unemployment rate, X (index, 1992 = 100), forCanada, the United Kingdom, and the United States for the period 1980?2006.
Consider the model:
Yit = ?1 + ?2Xit + uit ?????. (1)
a. A priori, what is the expected relationship between Y and X? Why?
b. Estimate the model given in Eq. (1) for each country.
c. Estimate the model, pooling all of the 81 observations.
d. Estimate the fixed effects model.
e. Estimate the error components model.
f. Which is a better model, FEM or ECM? Justify your answer (Hint: Apply the Hausman Test).
Fantastic news! We've Found the answer you've been seeking!
Step by Step Answer:
a A priori one would expect an inverse relationship between the two because if unemployment is hig...View the full answer

Answered By
Ramesh Lokesh
I am working as online tutor in the Coursehero for past 1 and half year where mine answers helped over 7000 students and i answered around 650 questions and having 5 star rating
0 Reviews
10+ Question Solved
Related Book For 

Question Posted:
