

Plot the following production possibility schedule: Put houses on the horizontal axis. Give the slope between A
Question:
Plot the following production possibility schedule:
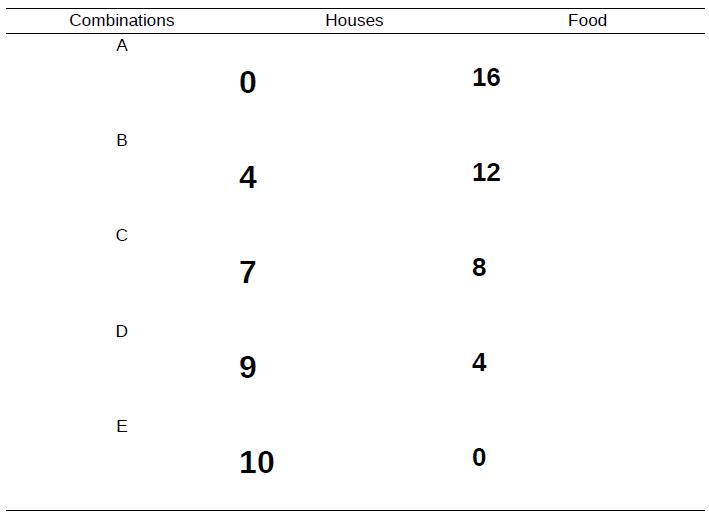
Put houses on the horizontal axis. Give the slope between A and B, B and C, and so forth. What does the slope represent? Is this cost increasing or decreasing?
Fantastic news! We've Found the answer you've been seeking!
Step by Step Answer:
At zero houses the curve begins at 16 units of food and then falls until at 10 houses ...View the full answer

Answered By
Subash Murugaih
I am leading expert in this web site couple of years and My clients are much happy with my works and services.
309+ Reviews
539+ Question Solved
Related Book For 
Question Posted:
