

Indicate which panel in Figure 22 best represents the relationships below. Assume that the first term is
Question:
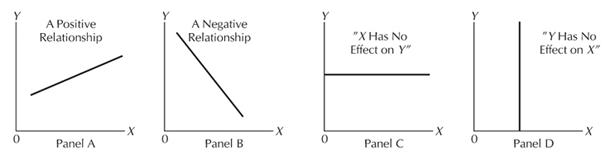
Indicate which panel in Figure 2–2 best represents the relationships below. Assume that the first term is the X variable on the horizontal axis (such that X is the cause and Y is the effect).
a. Population of a city and the cost of a home.
b. The amount of wheat grown on a small farm and the world price of wheat (i.e., how the world price of wheat will change when the small farm grows more wheat).
c. The fine for speeding and the fraction of the population that speeds.
d. The pay for teachers and the number of people who want to become teachers.
Figure 2-3:
Fantastic news! We've Found the answer you've been seeking!
Step by Step Answer:
a Panel A Houses usually cost more in large c...View the full answer

Answered By
Divya Munir
I hold M.Sc and M.Phil degrees in mathematics from CCS University, India and also have a MS degree in information management from Asian institute of technology, Bangkok, Thailand. I have worked at a international school in Bangkok as a IT teacher. Presently, I am working from home as a online Math/Statistics tutor. I have more than 10 years of online tutoring experience. My students have always excelled in their studies.
0 Reviews
10+ Question Solved
Related Book For 

Question Posted:
