

Use the following data to work Problems. Draw a graph that shows the relationship between the two
Question:
Use the following data to work Problems. Draw a graph that shows the relationship between the two variables x and y :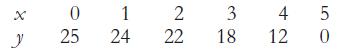 Calculate the slope of the relationship between x and y when x equals 3.
Fantastic news! We've Found the answer you've been seeking!
Step by Step Answer:
To solve this problem we need to take two steps 1 Draw a graph representing the relationship between ...View the full answer

Answered By
Ayush Jain
Subjects in which i am expert:
Computer Science :All subjects (Eg. Networking,Database ,Operating System,Information Security,)
Programming : C. C++, Python, Java, Machine Learning,Php
Android App Development, Xamarin, VS app development
Essay Writing
Research Paper
History, Management Subjects
Mathematics :Till Graduate Level
1+ Reviews
10+ Question Solved
Related Book For 

Question Posted:
