

Question: Use the following table to work Problems . The table gives the price of a balloon ride, the temperature, and the number of rides a
Use the following table to work Problems . The table gives the price of a balloon ride, the temperature, and the number of rides a day.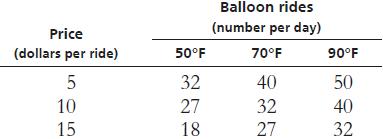
What happens in the graph in Problem 10 if the temperature rises to 90°F?
Problem 10
Draw a graph to show the relationship between
the price and the number of rides when the temperature
is 70°F. Describe this relationship.
The table gives the price of a balloon ride, the temperature, and the number of rides a day.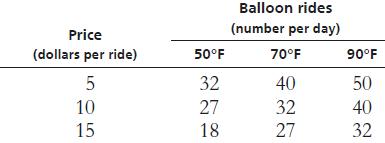
Price (dollars per ride) 5 10 15 50F 32 27 18 Balloon rides (number per day) 70F 40 32 27 90F 50 40 32
Step by Step Solution
3.43 Rating (156 Votes )
There are 3 Steps involved in it
Youve provided a table with the number of balloon rides per day at different temperatures for given ... View full answer

Get step-by-step solutions from verified subject matter experts