

Question: What happens in the graph in Problem 10 if the temperature rises to 30C? The table gives the price of a balloon ride, the temperature,
What happens in the graph in Problem 10 if the temperature rises to 30°C?
The table gives the price of a balloon ride, the temperature, and the number of rides a day.
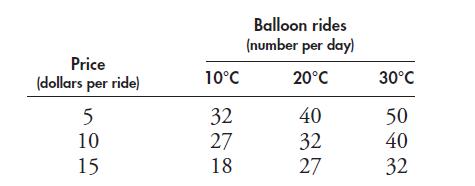
Price (dollars per ride) 5 10 15 10C 32 27 18 Balloon rides (number per day) 20C 40 32 27 30C 50 40 32
Step by Step Solution
★★★★★
3.34 Rating (154 Votes )
There are 3 Steps involved in it
1 Expert Approved Answer
Step: 1 Unlock

If the temperature rises to 30C the number of rides per day will ... View full answer
Question Has Been Solved by an Expert!
Get step-by-step solutions from verified subject matter experts
Step: 2 Unlock
Step: 3 Unlock