

Draw the utility possibilities schedule based on the data from Problem 1. Mark the points that maximize
Question:
Draw the utility possibilities schedule based on the data from Problem 1. Mark the points that maximize social welfare under the two alternative criteria from Problems 2 and 3.
Data From Problem 1
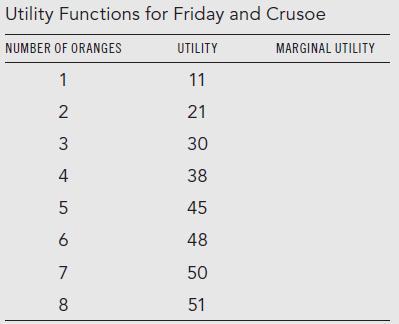
Assume that Crusoe and Friday have identical utility functions described by the following table.
Draw the utility function. Fill in the marginal utility data in the table above, and draw the marginal utility function.
Data from Problems 2
Assume that there are eight oranges to be divided between Friday and Crusoe. Take a utilitarian view-assume that social welfare is the sum of the utilities of the two individuals. Using the data from Problem 1, what is the social welfare corresponding to each possible allocation of oranges? What allocation maximizes social welfare? Show that it has the property that the marginal utility of an extra orange given to each individual is the same.
Data from Problems 3
Now take a Rawlsian view and assume that the social welfare function is the level of utility of the individual with the lowest utility level. Using the data from Problem 1, and again assuming there are eight oranges, what is the social welfare associated with each allocation of oranges? What allocation maximizes social welfare?
Step by Step Answer:

This question has not been answered yet.
You can Ask your question!


Economics Of The Public Sector
ISBN: 9780393925227
4th Edition
Authors: Joseph E. Stiglitz, Jay K. Rosengard
