

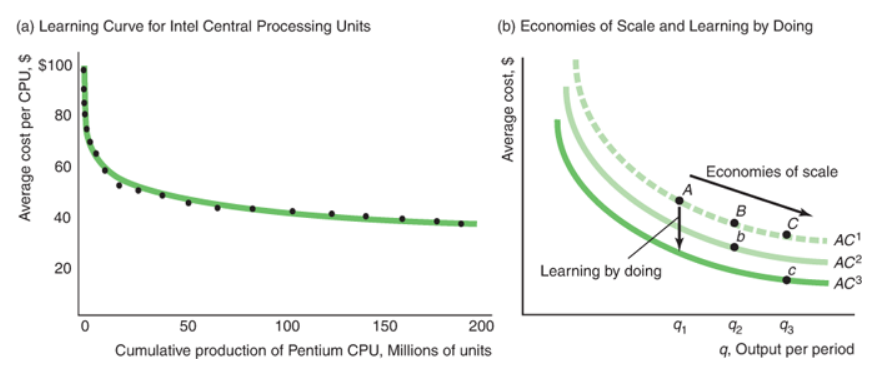
Panel a of Figure 6.8 shows that Intels average cost in a given year falls with the
Question:
a. What is the total cost and the average cost over the two years combined if the firm produces 20 in year 1 and 40 in year 2?
b. What is the total cost and average cost over the two years combined if the firm produces 60 in year 1 and 40 in year 2?
c. Over the two years combined, what is the true additional cost of producing 60 instead of 20 in year 1?
Figure 6.8
Fantastic news! We've Found the answer you've been seeking!
Step by Step Answer:
a The total cost is 20 per unit multiplied by 50 units in year 1 total ...View the full answer

Answered By
PALASH JHANWAR
I am a Chartered Accountant with AIR 45 in CA - IPCC. I am a Merit Holder ( B.Com ). The following is my educational details.
PLEASE ACCESS MY RESUME FROM THE FOLLOWING LINK: https://drive.google.com/file/d/1hYR1uch-ff6MRC_cDB07K6VqY9kQ3SFL/view?usp=sharing
3+ Reviews
10+ Question Solved
Related Book For 
Managerial Economics and Strategy
ISBN: 978-0134167879
2nd edition
Authors: Jeffrey M. Perloff, James A. Brander
Question Posted:
