

Question: Consider the simple linear regression model fit to the solar energy data in Problem 2.3. Problem 2.3 Table B. 2 presents data collected during a
Consider the simple linear regression model fit to the solar energy data in Problem 2.3.
Problem 2.3
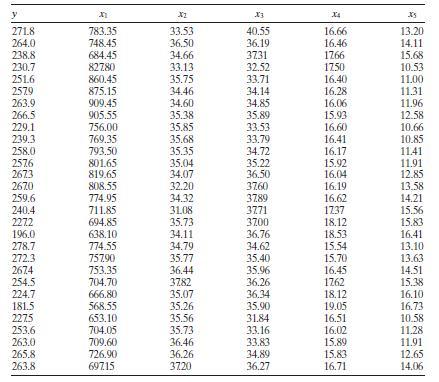
Table B. 2 presents data collected during a solar energy project at Georgia Tech.
a. Construct a normal probability plot of the residuals. Does there seem to be any problem with the normality assumption?
b. Construct and interpret a plot of the residuals versus the predicted response.
y X3 271.8 783.35 33.53 40.55 16.66 13.20 264.0 748.45 36.50 36.19 16.46 14.11 238.8 684.45 34.66 3731 1766 15.68 230.7 82780 33.13 32.52 1750 10.53 251.6 860,45 35.75 33.71 16.40 11.00 2579 875.15 34.46 34.14 16.28 11.31 263.9 909.45 34.60 34.85 16.06 11.96 266.5 905.55 35.38 35.89 15.93 12.58 229.1 756.00 35.85 33.53 16.60 10.66 239.3 769.35 35.68 33.79 16.41 10.85 258.0 793.50 35.35 34.72 16.17 11.41 2576 801.65 35.04 35.22 15.92 11.91 2673 819.65 34.07 36.50 16.04 12.85 2670 808.55 32.20 3760 16:19 13.58 259.6 774.95 34.32 3789 16.62 14.21 240.4 711.85 31.08 3771 1737 15.56 2272 694.85 35.73 3700 18.12 15.83 196.0 638.10 34.11 36.76 18.53 16.41 278.7 774.55 34.79 34.62 15.54 13.10 272.3 75790 35.77 35.40 15.70 13.63 2674 753.35 36.44 35.96 16.45 14.51 254.5 704.70 3782 36.26 1762 15.38 224.7 666.80 35.07 36.34 18.12 16.10 181.5 568.55 35.26 35.90 19.05 16.73 2275 653.10 35.56 31.84 16.51 10.58 253.6 704.05 35.73 33.16 16.02 11.28 263.0 709.60 36.46 33.83 15.89 11.91 265.8 726.90 36.26 34.89 15.83 12.65 263.8 69715 3720 36.27 16.71 14.06
Step by Step Solution
3.38 Rating (157 Votes )
There are 3 Steps involved in it

Get step-by-step solutions from verified subject matter experts