

Use the following data to answer the questions below: a. Graph the consumption function with consumption spending
Question:
Use the following data to answer the questions below: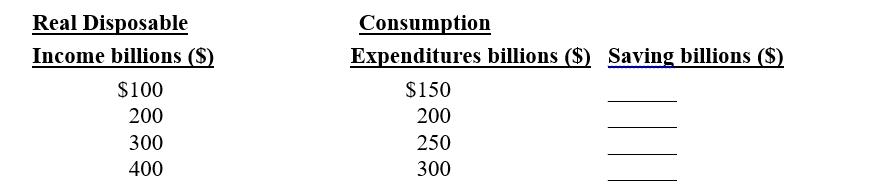
a. Graph the consumption function with consumption spending on the vertical axis and disposable income on the horizontal axis.
b. If the consumption function is a straight line, what is its slope?
c. Fill in the saving column at each level of income.
Fantastic news! We've Found the answer you've been seeking!
Step by Step Answer:
a b The slope is 12 equal to the marginal ...View the full answer

Answered By
OTIENO OBADO
I have a vast experience in teaching, mentoring and tutoring. I handle student concerns diligently and my academic background is undeniably aesthetic
3+ Reviews
10+ Question Solved
Related Book For 
Economics A Contemporary Introduction
ISBN: 9781305505469
11th Edition
Authors: William A. McEachern
Question Posted:
