Using the data shown on the pie charts in Figure 11.1, construct two Lorenz curves (on the
Question:
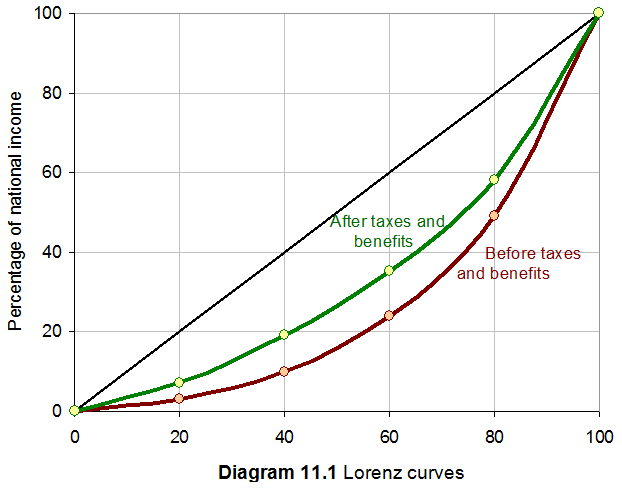
Using the data shown on the pie charts in Figure 11.1, construct two Lorenz curves (on the same diagram), corresponding to the before- and after-tax income figures. Interpret and comment on the diagram you have drawn.

Transcribed Image Text:
100 80 60 After taxes and benefits 40 Before taxes and benefits 20 100 20 40 60 80 Diagram 11.1 Lorenz curves Percentage of national income
Fantastic news! We've Found the answer you've been seeking!
Step by Step Answer:
Answer rating: 58% (12 reviews)
The unequal distribution of income in the UK can clea...View the full answer

Answered By

Wahome Michael
I am a CPA finalist and a graduate in Bachelor of commerce. I am a full time writer with 4 years experience in academic writing (essays, Thesis, dissertation and research). I am also a full time writer which assures you of my quality, deep knowledge of your task requirement and timeliness. Assign me your task and you shall have the best.
Thanks in advance
4.90+
63+ Reviews
132+ Question Solved
Related Book For 

Question Posted:
Students also viewed these Business questions
-
Construct a table from the data shown on the graph below. Which is the dependent variable and which the independent variable? Summarize the data in equationform. 100 e 80 60 40 20 0 2 46810 Study...
-
Using the data shown in Exercise 5-38, journalize the entries for the transactions, assuming that Air Systems Company uses the perpetual inventory system. In Exercise 5-38, The following selected...
-
Using the data shown in Exercise 6-38, journalize the entries for the transactions assuming that Artic Company uses the perpetual inventory system.
-
2. A firm's or cash flow, is its profits after deductions for all expenses, including or wear and tear on capital goods such as machinery.
-
How many waiting lines did you encounter during your last airline flight?
-
Refer to the financial statements of Express, Inc. in Appendix C at the end of the book. The dollars are in thousands in the requirements; show your answers in thousands of dollars. Required: 1. What...
-
Several professionals are listed as being part of compliance efforts with regard to participation in the examination of potential compliance violations. Identify at least three other categories of...
-
Use this information to prepare a net worth analysis of Slicks girlfriend. Steve (Slick) Willy, 45, just got out of jail. As a reformed citizen on parole, Slick decides to go into business for...
-
2. (SGS) In this problem, we introduce another version of Gauss-Seidel method. The symmetric Gauss-Seidel method combines the forward and backward versions of Gauss- Seidel methods. We know that FGS...
-
Assume that you were hired by a government to advise it on the design of its tax system. Discuss some factors that would be relevant to the advice that you would give. In your answer, discuss how...
-
Let us imagine that a new regulation on holidays is proposed by the government that all workers are to receive an extra four weeks pay per year, but that they may give up some or all of this extra...
-
Just under two million pensioners were identified as living in poverty in the UK in 2016. In the same year it was estimated that total property wealth of pensioner households had grown to a record...
-
A 1.6-F capacitor, initially uncharged, is connected in series with a 10-k resistor and a 5.0-V battery of negligible internal resistance. (a) What is the charge on the capacitor after a very long...
-
What is Par Value??
-
Your company uses stock-to-sales ratios for planning end-of-the-month and beginning-of-the-month inventory levels. If you've forecasted sales for the month of February to be $240,000 and you are...
-
Discuss (1) why estimated overhead is used, (2) how the estimated overhead rate is calculated, and (3) how the allocation base is determined?
-
Complete the bank reconciliation below by making the appropriate selections. Assume that all deposits, checks, and other withdrawals have been recorded in your check register. Balance per your check...
-
Joohee sells 100 shares of Acme, Inc. on November 1, 2021 for $20,000. Her basis in the shares was $15,000. On November 17th, Joohee repurchased 50 shares of Acme, Inc. How much of the gain from...
-
In an opinion column in the New York Times, economist Justin Wolfers of the University of Michigan noted, "Over recent years, policy makers have also worked to lower long-term interest rates by...
-
Perform the operation by first converting the numerator and denominator to scientific notation. Write the answer in scientific notation. 7,200,00/0.000009
-
On July 1 Nancy Regan paid $600,000 for commercial building and an additional $150,000 for the land on which it stands. Four years later, also on July 1, s be sold the property for $850,000. Compute...
-
A group of investors has formed Trump Corporation to purchase a small hotel. The asking price is $150,000 for the land and $850,000 for the hotel building if the purchase takes place in June, compute...
-
A company is considering buying a new piece of machinery. A 10% interest rate will be used in the computations. Two models of the machine are available. (a) Determine which machine should be...
-
A mail clerk found that the total weight of 155 packages was 815 pounds. If each of the packages weighed either 3 pounds or 8 pounds, how many of the packages weighed 8 pounds?
-
A computer is purchased for $2816 and depreciates at a constant rate to $0 in 8 years. Find a formula for the value, V, of the computer after t years have passed.
-
Cathy pays $25 a month plus $0.05 per text message. She models this with the function C=0.05x+25. If the text messaging fee increases to $0.10, what is her new function?

Study smarter with the SolutionInn App


