

Question: Draw a graph to determine whether a linear model would be appropriate for each set of data. AD V 0 15 25 40 60 80
Draw a graph to determine whether a linear model would be appropriate for each set of data.
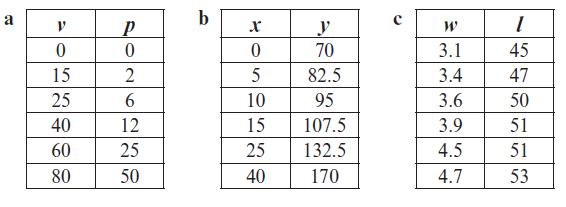
AD V 0 15 25 40 60 80 P 0 2 6 12 25 50 b X y 0 70 5 82.5 10 95 15 107.5 25 132.5 40 170 W 3.1 3.4 3.6 3.9 4.5 4.7 I 45 47 50 51 51 53
Step by Step Solution
★★★★★
3.44 Rating (173 Votes )
There are 3 Steps involved in it
1 Expert Approved Answer
Step: 1 Unlock

We can draw the required graphs as shown below Based on the abov... View full answer
Question Has Been Solved by an Expert!
Get step-by-step solutions from verified subject matter experts
Step: 2 Unlock
Step: 3 Unlock