

Question: a. Plot the 1-V curve for the same solar cell of Fig. 16.15 but with a light intensity of f c1 . b. Plot the
a. Plot the 1-V curve for the same solar cell of Fig. 16.15 but with a light intensity of fc1.
b. Plot the resulting power curve from the results of part (a).
c. What is the maximum power rating? How dews it compare to the maximum power rating for a light intensity fc2?
Fig. 16.15
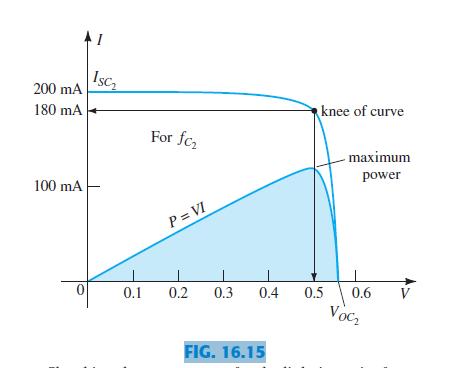
Isc 200 mA 180 mA knee of curve For fcz maximum power 100 mA P= VI 0.1 0.2 0.3 0.4 0.5 0.6 V Vocz FIG. 16.15
Step by Step Solution
★★★★★
3.29 Rating (164 Votes )
There are 3 Steps involved in it
1 Expert Approved Answer
Step: 1 Unlock

Answer a The 1V curve for the solar cell with a l... View full answer
Question Has Been Solved by an Expert!
Get step-by-step solutions from verified subject matter experts
Step: 2 Unlock
Step: 3 Unlock