

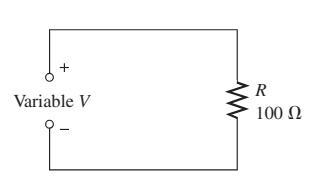
A variable voltage source is connected to the circuit of Figure 335. Start at 0 V and
Question:
A variable voltage source is connected to the circuit of Figure 3–35. Start at 0 V and increase the voltage in 10 V steps up to 100 V. Determine the current at each voltage value, and plot a graph of V versus I. Is the graph a straight line? What does the graph indicate?
Data in Figure 3–35
Fantastic news! We've Found the answer you've been seeking!
Step by Step Answer:
To determine the current at each voltage value and plot the VI graph we need additional information ...View the full answer

Answered By
Saleem Abbas
Have worked in academic writing for an a years as my part-time job.
1+ Reviews
10+ Question Solved
Related Book For 

Question Posted:
