

Question: Draw the waveforms for the load current and voltage for Figure 1683. Show the peak values. 50 V 0 n -50 V FIGURE 16-83 RL
Draw the waveforms for the load current and voltage for Figure 16–83. Show the peak values.
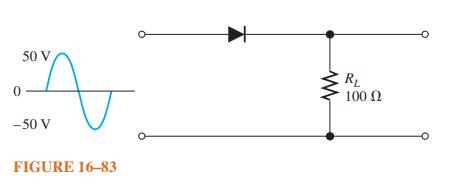
50 V 0 n -50 V FIGURE 16-83 RL 100
Step by Step Solution
★★★★★
3.41 Rating (170 Votes )
There are 3 Steps involved in it
1 Expert Approved Answer
Step: 1 Unlock

The waveforms for the load current and voltage for Figure 1683 are sh... View full answer
Question Has Been Solved by an Expert!
Get step-by-step solutions from verified subject matter experts
Step: 2 Unlock
Step: 3 Unlock