

Plot the response curve for the circuit in Figure 1249. Show the output voltage versus frequency in
Question:
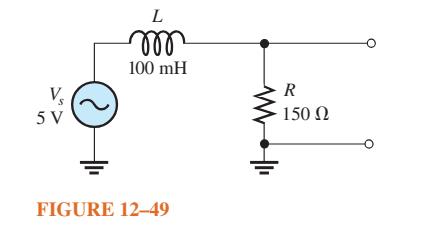
Plot the response curve for the circuit in Figure 12–49. Show the output voltage versus frequency in 200 Hz increments from 0 to 1200 Hz.
Fantastic news! We've Found the answer you've been seeking!
Step by Step Answer:
The circuit in Figure 1249 is a series RL circuit with VS representing the voltage source L the inductor with a value of 100 mH milliHenrys and R the ...View the full answer

Answered By
Charles mwangi
I am a postgraduate in chemistry (Industrial chemistry with management),with writing experience for more than 3 years.I have specialized in content development,questions,term papers and assignments.Majoring in chemistry,information science,management,human resource management,accounting,business law,marketing,psychology,excl expert ,education and engineering.I have tutored in other different platforms where my DNA includes three key aspects i.e,quality papers,timely and free from any academic malpractices.I frequently engage clients in each and every step to ensure quality service delivery.This is to ensure sustainability of the tutoring aspects as well as the credibility of the platform.
2+ Reviews
10+ Question Solved
Related Book For 

Question Posted:
