

Question: Construct a histogram, frequency polygon, and ogive for the data in Exercise 22. Analyze the histogram. Data from in Exercise 22 The following data represent
Construct a histogram, frequency polygon, and ogive for the data in Exercise 22. Analyze the histogram.
Data from in Exercise 22
The following data represent the energy consumption of coal (in billions of Btu) by each of the 50 states and the District of Columbia. Use the data to construct a frequency distribution and a relative frequency distribution with 7 classes.
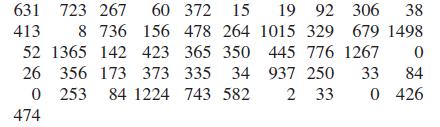
631 723 267 60 372 15 19 92 306 38 413 679 1498 8 736 156 478 264 1015 329 52 1365 142 423 365 350 445 776 1267 0 26 356 173 373 335 34 937 250 33 0 253 84 1224 743 2 33 0 426 84 582 474
Step by Step Solution
3.39 Rating (158 Votes )
There are 3 Steps involved in it
To construct a histogram frequency polygon and ogive for the given data we first need ... View full answer

Get step-by-step solutions from verified subject matter experts