The following data represent the energy consumption of coal (in billions of Btu) by each of the
Question:
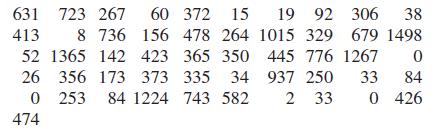
The following data represent the energy consumption of coal (in billions of Btu) by each of the 50 states and the District of Columbia. Use the data to construct a frequency distribution and a relative frequency distribution with 7 classes.
Transcribed Image Text:
631 723 267 60 372 15 19 92 306 38 8 736 156 478 264 1015 329 679 1498 413 52 1365 142 423 365 350 445 776 1267 26 356 173 373 335 34 937 250 33 0 253 84 1224 743 582 2 33 474 0 84 0 426
Fantastic news! We've Found the answer you've been seeking!
Step by Step Answer:
Answer rating: 50% (6 reviews)
To construct a frequency distribution and a relative frequency distribution with 7 classes we need t...View the full answer
Answered By
Dulal Roy
As a tutor, I have gained extensive hands-on experience working with students one-on-one and in small group settings. I have developed the ability to effectively assess my students' strengths and weaknesses, and to customize my teaching approach to meet their individual needs.
I am proficient at breaking down complex concepts into simpler, more digestible pieces, and at using a variety of teaching methods (such as visual aids, examples, and interactive exercises) to engage my students and help them understand and retain the material.
I have also gained a lot of experience in providing feedback and guidance to my students, helping them to develop their problem-solving skills and to become more independent learners. Overall, my hands-on experience as a tutor has given me a deep understanding of how to effectively support and encourage students in their learning journey.
0.00
0 Reviews
10+ Question Solved
Related Book For
Elementary Statistics A Step By Step Approach
ISBN: 9780077665807
9th Edition
Authors: Allan G. Bluman
Question Posted:
Students also viewed these Statistics questions
-
Construct a histogram, frequency polygon, and ogive for the data in Exercise 22. Analyze the histogram. Data from in Exercise 22 The following data represent the energy consumption of coal (in...
-
The following data represent the median household income (in dollars) for the 50 states and the District of Columbia in 2013. With the first class having a lower class limit of 35,000 and a class...
-
The following table shows some information on a variety of different vehicles. Using the information given in table 1, answer question 1a 1d - Table 1: Vehicles Engine Number Vehicle City Hwy Model...
-
Subsequent Events and Subsequently Discovered Facts. Michael Ewing is auditing the financial statements of Dallas Company for the year ended December 31, 2014. In concluding the process of gathering...
-
In what way is a kanban system similar to the EOQ-ROP system of Chapter 12?
-
How many disk operations are needed to fetch the i-node for afile with the path name /usr/ast/courses/os/handout.t? Assume that the i-node for the root directory is in memory, but nothing else along...
-
The dataset ToyotaCorolla.jmp contains data on used cars on sale during the late summer of 2004 in the Netherlands. It has 1436 records containing details on 38 attributes, including Price, Age,...
-
The August 31 bank statement of Well Healthcare has just arrived from United Bank. To prepare the bank reconciliation, you gather the following data: a. The August 31 bank balance is $4,540. b. The...
-
Larner Corporation is a diversified manufacturer of industrial goods. The company's activity-based costing system contains the following six activity cost pools and activity rates: Activity Cost Pool...
-
A new bus route has been established between downtown Denver and Englewood, a suburb of Denver. Dan has taken the bus to work for many years. For the old bus route, he knows from long experience that...
-
Construct a Pareto chart and a horizontal bar graph for the number of tons (in millions) of trash recycled per year by Americans based on an Environmental Protection Agency study. Paper Iron/steel...
-
Construct a histogram, a frequency polygon, and an ogive for the data in Exercise 20. Data from in Exercise 20 When 30 randomly selected customers left a convenience store, each was asked the number...
-
Find the heat transfer in Problem 4.67. A piston/cylinder contains 1 kg of liquid water at 20C and 300 kPa. Initially the piston floats, similar to the setup in Problem 4.64, with a maximum enclosed...
-
Given the following information, determine the cost of the inventory at June 30 using the LIFO perpetual inventory method. Date June 1 June 15 June 29 Activities Beginning inventory Units Acquired at...
-
Sell or Process Further Port Allen Chemical Company processes raw material D into joint products E and F. Raw material D costs $6 per liter. It costs $100 to convert 100 liters of D into 60 liters of...
-
Froya Fabrikker A/S of Bergen, Norway, is a small company that manufactures specialty heavy equipment for use in North Sea oil fields. The company uses a job-order costing system that applies...
-
Piedmont Company segments its business into two regions-North and South. The company prepared the contribution format segmented income statement as shown: Sales Variable expenses Contribution margin...
-
The gross profit margin M = M ( G , T ) is given by the formula M= G T . Use functional notation to express the gross profit margin for a company that has a gross profit of $ 3 5 5 , 0 0 0 and a...
-
Let f be a convex function on an open set S that is bounded above by M in a neighborhood of x0; that is, there exists an open set f containing x0 such that f(x) ¥ M for every x U 1. Show that...
-
What tools are available to help shoppers compare prices, features, and values and check other shoppers opinions?
-
The data show the heights (in feet) of the 10 largest dams in the United States. Identify the five-number summary and the interquartile range, and draw a boxplot. 770 730 717 710 645 606 602 585 578...
-
A four-month record for the number of tornadoes in 20132015 is given here. a. Which month had the highest mean number of tornadoes for this 3-year period? May: b. Which year has the highest mean...
-
The data show the number of bank failures over a 15-year period. Find the mean, median, midrange, and mode for the data. 14 24 51 92 157 148 30 3 0 0 4 3 11 4 7
-
On January 1st. 2018, X Company purchased 80% of the outstanding common shares of Y for $2 million in cash . On this date, the shareholders' equity of Y consisted of $1,000,000 no par value common...
-
In a small town, two restaurants compete in the market for pizza. Each restaurant must decide whether to advertise or not. The potential monthly profits for these firms are shown below (in thousands...
-
How much money is required now to provide an income of $1,600 per month for six years if the money earns interest at 6% p.a. compounding monthly and the first $1,600 payment is payable 2 years from...
Study smarter with the SolutionInn App