

Question: Construct a pie graph for the data in Exercise 18. Data from in Exercise 18 A questionnaire on housing arrangements showed this information obtained from
Construct a pie graph for the data in Exercise 18.
Data from in Exercise 18
A questionnaire on housing arrangements showed this information obtained from 25 respondents. Construct a frequency distribution for the data (H = house, A = apartment, M =mobile home, C = condominium).
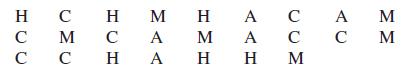
C M C A C H H A M A H C C A
Step by Step Solution
★★★★★
3.44 Rating (163 Votes )
There are 3 Steps involved in it
1 Expert Approved Answer
Step: 1 Unlock

Given that the frequency distribution is Class Frequency H 6 A 5 M 6 ... View full answer
Question Has Been Solved by an Expert!
Get step-by-step solutions from verified subject matter experts
Step: 2 Unlock
Step: 3 Unlock