

Question: Using the data from Data Set IX in Appendix B, divide the United States into four regions, as follows: Northeast CT ME MA NH NJ
Using the data from Data Set IX in Appendix B, divide the United States into four regions, as follows:
Northeast CT ME MA NH NJ NY PA RI VT
Midwest IL IN IA KS MI MN MD MS NE ND OH SD WI
South AL AR DE DC FL GA KY LA MD NC OK
SC TN TX VA WV
West AK AZ CA CO HI ID MT NV NM OR UT
WA WY
Find the total population for each region, and draw a Pareto chart and a pie graph for the data. Analyze the results. Explain which chart might be a better representation for the data.
Data from Set IX Appendix B
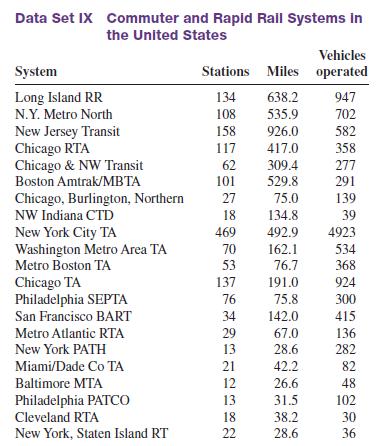
Data Set IX Commuter and Rapid Rail Systems in the United States System Long Island RR N.Y. Metro North New Jersey Transit Chicago RTA Chicago & NW Transit Boston Amtrak/MBTA Chicago, Burlington, Northern NW Indiana CTD New York City TA Washington Metro Area TA Metro Boston TA Chicago TA Philadelphia SEPTA San Francisco BART Metro Atlantic RTA New York PATH Miami/Dade Co TA Baltimore MTA Philadelphia PATCO Cleveland RTA New York, Staten Island RT Stations 134 108 158 117 62 101 27 18 469 70 53 137 76 34 29 13 21 12 13 18 22 Vehicles Miles operated 638.2 535.9 926.0 417.0 309.4 529.8 75.0 134.8 492.9 162.1 76.7 191.0 75.8 142.0 67.0 28.6 42.2 26.6 31.5 38.2 28.6 947 702 582 358 277 291 139 39 4923 534 368 924 300 415 136 282 82 48 102 30 36
Step by Step Solution
3.21 Rating (159 Votes )
There are 3 Steps involved in it

Get step-by-step solutions from verified subject matter experts