

Question: Construct a scatter plot for the data obtained in a study on the number of absences and the final grades of seven randomly selected students
Construct a scatter plot for the data obtained in a study on the number of absences and the final grades of seven randomly selected students from a statistics class. The data are shown here.
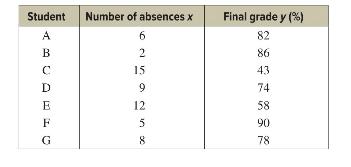
Student Number of absences x Final grade y (%) ABCDEFC 6 82 2 15 86 43 12 G 92500 74 58 90 8 78
Step by Step Solution
★★★★★
3.44 Rating (157 Votes )
There are 3 Steps involved in it
1 Expert Approved Answer
Step: 1 Unlock

Step 1 Draw and label the x and y axes Step 2 Plot each point ... View full answer
Question Has Been Solved by an Expert!
Get step-by-step solutions from verified subject matter experts
Step: 2 Unlock
Step: 3 Unlock