

Question: Exercise contain graphs portraying the decision criterion for a one-mean z-test. The curve in each graph is the normal curve for the test statistic under
Exercise contain graphs portraying the decision criterion for a one-mean z-test. The curve in each graph is the normal curve for the test statistic under the assumption that the null hypothesis is true. For each exercise, determine the
a. Rejection region.
b. Nonrejection region.
c. Critical value(s).
d. Significance level.
e. Construct a graph similar to that in Fig. 9.3 on page 361 that depicts your results from parts (a)–(d).
f. Identify the hypothesis test as two-tailed, left-tailed, or right-tailed.
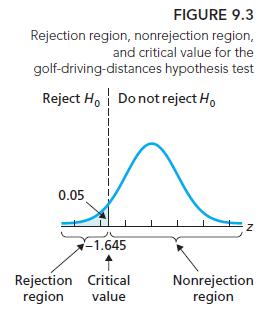
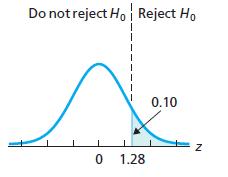
FIGURE 9.3 Rejection region, nonrejection region, and critical value for the golf-driving-distances hypothesis test Reject Ho Do not reject Ho 0.05 I T 1 -1.645 Rejection Critical region value N Nonrejection region
Step by Step Solution
3.41 Rating (157 Votes )
There are 3 Steps involved in it
a Rejection region As we know that a rejected region specifies a set of values of the test statistic for which the null hypotheses is rejected and for ... View full answer

Get step-by-step solutions from verified subject matter experts