

Question: For Exercises do a complete regression analysis. a. Draw the scatter plot. b. Compute the value of the correlation coefficient. c. Test the significance of
For Exercises do a complete regression analysis.
a. Draw the scatter plot.
b. Compute the value of the correlation coefficient.
c. Test the significance of the correlation coefficient at α = 0.05.
d. Determine the regression line equation if r is significant.
e. Plot the regression line on the scatter plot if appropriate.
f. Predict Ý for a specific value of x if appropriate.
A study is conducted to determine the relationship between a driver’s age and the number of accidents he or she has over a 1-year period. The data are shown here. If there is a significant relationship, predict the number of accidents of a driver who is 64.
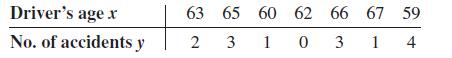
Driver's age x No. of accidents y 63 65 60 62 66 2 3 103 3 67 59 14
Step by Step Solution
3.41 Rating (173 Votes )
There are 3 Steps involved in it
To conduct a complete regression analysis for the relationship between a drivers age and the number of accidents they have over a 1year period we will ... View full answer

Get step-by-step solutions from verified subject matter experts