

Question: For Exercises perform the following steps. a. Draw the scatter plot for the variables. b. Compute the value of the correlation coefficient. c. State the
For Exercises perform the following steps.
a. Draw the scatter plot for the variables.
b. Compute the value of the correlation coefficient.
c. State the hypotheses.
d. Test the significance of the correlation coefficient at α = 0.05, using Table I.
e. Give a brief explanation of the type of relationship.
Assume all assumptions have been met.
There are many interesting relationships among the various nutrients found in fruits and vegetables. Listed below are the number of grams of carbohydrates and the number of kilocalories for a 100-gram sample of various raw foods. Is there a linear relationship between the variables?
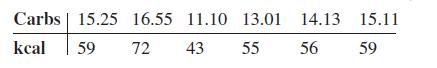
Carbs 15.25 16.55 11.10 13.01 14.13 15.11 kcal 59 72 43 55 56 59
Step by Step Solution
3.46 Rating (159 Votes )
There are 3 Steps involved in it
To perform the given steps we can follow the following procedure a Draw the scatter plot for the variables We can create a scatter plot to visualize t... View full answer

Get step-by-step solutions from verified subject matter experts