

Question: For Exercises do a complete regression analysis. a. Draw the scatter plot. b. Compute the value of the correlation coefficient. c. Test the significance of
For Exercises do a complete regression analysis.
a. Draw the scatter plot.
b. Compute the value of the correlation coefficient.
c. Test the significance of the correlation coefficient at α = 0.05.
d. Determine the regression line equation if r is significant.
e. Plot the regression line on the scatter plot if appropriate.
f. Predict Ý for a specific value of x if appropriate.
A medical researcher wants to determine the relationship between the price per dose of prescription drugs in the United States and the price of the same dose in Australia. The data are shown. Describe the relationship.
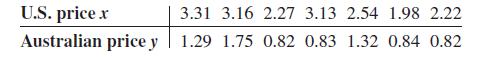
U.S. price x 3.31 3.16 2.27 3.13 2.54 1.98 2.22 Australian price y 1.29 1.75 0.82 0.83 1.32 0.84 0.82
Step by Step Solution
3.40 Rating (163 Votes )
There are 3 Steps involved in it
To perform a complete regression analysis with the given US and Australian drug prices we will execute the steps a through f as outlined Ill use Pytho... View full answer

Get step-by-step solutions from verified subject matter experts