

Question: For Exercises perform the following steps. a. Draw the scatter plot for the variables. b. Compute the value of the correlation coefficient. c. State the
For Exercises perform the following steps.
a. Draw the scatter plot for the variables.
b. Compute the value of the correlation coefficient.
c. State the hypotheses.
d. Test the significance of the correlation coefficient at α = 0.05, using Table I.
e. Give a brief explanation of the type of relationship.
Assume all assumptions have been met.
The average gasoline price per gallon (in cities) and the cost of a barrel of oil are shown
for a random selection of weeks from 2009–2010. Is
there a linear relationship between the variables?
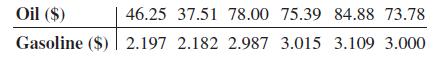
Oil ($) 46.25 37.51 78.00 75.39 84.88 73.78 Gasoline ($) 2.197 2.182 2.987 3.015 3.109 3.000
Step by Step Solution
3.52 Rating (165 Votes )
There are 3 Steps involved in it
To analyze the relationship between the average gasoline price per gallon and the cost of a barrel of oil lets follow the steps provided a Draw the sc... View full answer

Get step-by-step solutions from verified subject matter experts