

Question: For Exercises use the same data as for the corresponding exercises in Section 101. For each exercise, find the equation of the regression line and
For Exercises use the same data as for the corresponding exercises in Section 10–1. For each exercise, find the equation of the regression line and find the y value for the specified x value. Remember that no regression should be done when r is not significant.
The average gasoline price per gallon (in cities) and the cost of a barrel of oil are shown below for a random selection of weeks from 2009–2010.
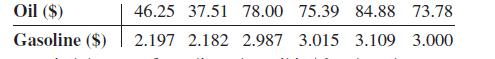
Find the cost of gasoline when oil is $60 a barrel.
The average gasoline price per gallon (in cities) and the cost of a barrel of oil are shown for a random selection of weeks from 2009–2010. Is there a linear relationship between the variables?
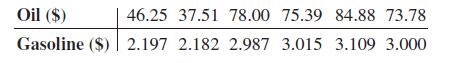
Oil ($) Gasoline ($) 46.25 37.51 78.00 75.39 84.88 73.78 2.197 2.182 2.987 3.015 3.109 3.000
Step by Step Solution
3.44 Rating (173 Votes )
There are 3 Steps involved in it
To determine if there is a linear relationship between the variables w... View full answer

Get step-by-step solutions from verified subject matter experts