

Question: From the Data Bank located in Appendix B, choose one of the following variables: age, weight, cholesterol level, systolic pressure, IQ, or sodium level. Select
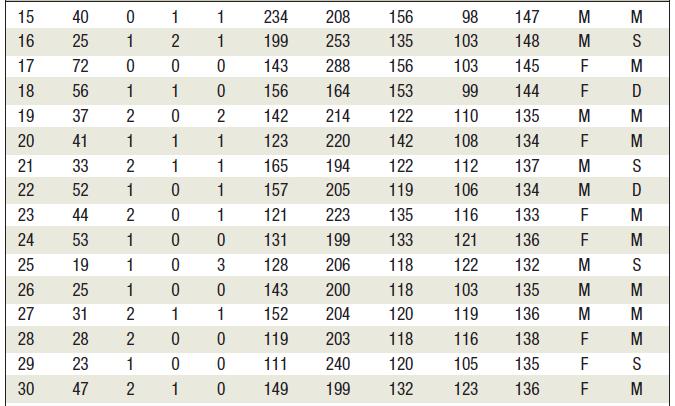
From the Data Bank located in Appendix B, choose one of the following variables: age, weight, cholesterol level, systolic pressure, IQ, or sodium level. Select at least 30 values. For these values, construct a grouped frequency distribution. Draw a histogram, frequency polygon, and ogive for the distribution. Describe briefly the shape of the distribution.
Data from Appendix B
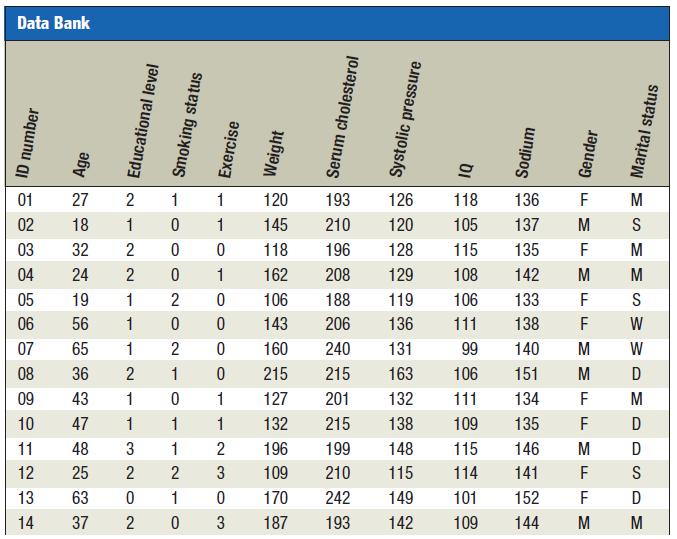
Data Bank ID number Age 01 27 02 18 03 32 04 24 05 19 06 56 07 65 36 43 47 48 25 63 37 08 09 10 11 12 13 14 Educational level 2 1 1 0 2 0 2 0 1 2 1 0 1 2 1 2 1 1 3 2 0 2 0 1 1 2 1 0 Smoking status Exercise Weight 1 120 1 145 0 118 1 162 0 106 0 143 0 160 0 215 1 1 2 3 0 3 127 132 196 109 170 187 Serum cholesterol Systolic pressure 242 193 01 193 126 118 210 120 105 196 128 115 208 129 108 188 119 106 206 136 111 240 131 99 215 163 106 201 132 111 215 138 109 199 148 115 210 115 114 149 101 142 109 Sodium Gender 136 137 M 135 142 133 138 140 151 134 135 146 141 152 144 LL 3 Marital status M F F M S F M M S W M W M D F M F D M D F S F D M M
Step by Step Solution
3.25 Rating (163 Votes )
There are 3 Steps involved in it

Get step-by-step solutions from verified subject matter experts