

Question: In Table 4.2, we provided data on age and price for a sample of 11 Orion's between 2 and 7 years old. On the WeissStats
In Table 4.2, we provided data on age and price for a sample of 11 Orion's between 2 and 7 years old. On the WeissStats site, we have given the ages and prices for a sample of 31 Orions between 1 and 11 years old.
a. Obtain a scatterplot for the data.
b. Is it reasonable to find a regression line for the data? Explain your answer.
Table 4.2
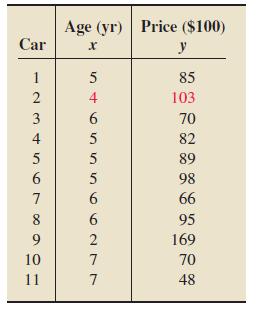
Car 123456 3 6 7 8 9 10 11 Age (yr) Price ($100) x y 5 4 6 5 5 5 6 6 277 7 85 103 70 82 89 98 66 95 169 70 48
Step by Step Solution
3.40 Rating (169 Votes )
There are 3 Steps involved in it
a Using Excel highlight the data along with the column names AGE and PRICE Select the Char... View full answer

Get step-by-step solutions from verified subject matter experts