

Section2.1 described a sample of (n=50) geographic areas (Zip codes) containing sales data on the Wisconsin state
Question:
Section2.1 described a sample of \(n=50\) geographic areas (Zip codes) containing sales data on the Wisconsin state lottery ( \(y=\) SALES). In that section, sales were analyzed using a basic linear regression model with \(x=P O P\), the area population, as the explanatory variable. This exercise extends that analysis by introducing additional explanatory variables given in Table 3.11
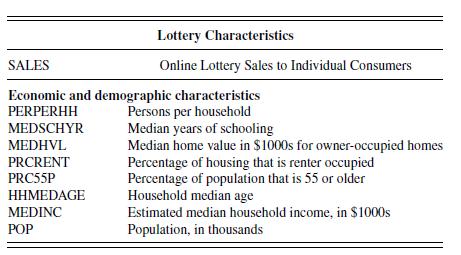
a. Produce a table of summary statistics for all variables. One Zip code (observation 11, Zip = 53211, Shorewood, Wisconsin, a suburb of Milwaukee) appears to have unusually large values of MEDSCHYR and MEDHVL. For this observation, how many standard deviations is the value of MEDSCHYR above the mean? For this observation, how many standard deviations is the value of MEDHVL above the mean?
b. Produce a table of correlations. What three variables are most highly correlated with SALES?
c. Produce a scatterplot matrix of all explanatory variables and SALES. In the plot of MEDSCHYR versus SALES, describe the position of observation 11.
d. Fit a linear model of SALES on all eight explanatory variables. Summarize the fit of this model by citing the residual standard deviation, \(s\); the coefficient of determination, \(R^{2}\); and its adjusted version, \(R_{a}^{2}\).
e. Based on your part (d) model fit, is MEDSCHYR a statistically significant variable? To respond to this question, use a formal test of hypothesis. State your null and alternative hypotheses, decision-making criterion, and decision-making rule.
f. Now fit a more parsimonious model, using SALES as the dependent variable and MEDSCHYR, MEDHVL, and POP as explanatory variables. Summarize the fit of this model by citing the residual standard deviation, \(s\); the coefficient of determination, \(R^{2}\); and its adjusted version, \(R_{a}^{2}\). How do these values compare to the model fit in part (d)?
g. Note that the sign of the regression coefficient associated with MEDSCHYR is now negative. To help interpret this coefficient, compute the corresponding partial correlation coefficient. What is the interpretation of this coefficient?
h. To get further insights into the relation between MEDSCHYR and SALES, produce an added variable plot controlling for the effects of MEDHVL and POP. Check that the correlation associated with this plot agrees with your answer in part \((\mathrm{g})\).
i. Rerun the regression in part (f), after removing observation 11. Cite the basic summary statistics from this regression. For this model fit, is MEDSCHYR a statistically significant variable? To respond to this question, use a formal test of hypothesis. State your null and alternative hypotheses, decision-making criterion, and decision-making rule.
j. Rerun the regression in part (f), after removing observation 9. Cite the basic summary statistics from this regression.
Step by Step Answer:

This question has not been answered yet.
You can Ask your question!

Regression Modeling With Actuarial And Financial Applications
ISBN: 9780521135962
1st Edition
Authors: Edward W. Frees
