

Shown is an ogive depicting the cumulative frequency of the average mathematics SAT scores by state. Use
Question:
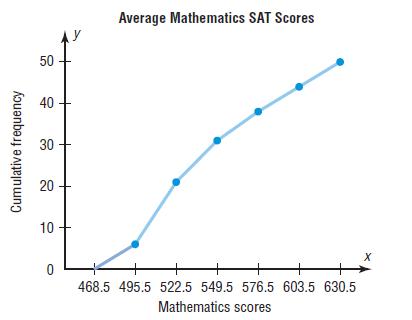
Shown is an ogive depicting the cumulative frequency of the average mathematics SAT scores by state. Use it to construct a histogram and a
frequency polygon.
Fantastic news! We've Found the answer you've been seeking!
Step by Step Answer:
Compute the class boundaries midpoints X m and frequency by using the given Ogive The general formul...View the full answer

Answered By
Umar Jalal
Hi
This is Umar.
I can help you in the following fields:
1. Accounting
2. Statistics
3. Chemistry
4. Physics
5. Computer Science (Programming)
6. MATH
Linear Algebra
Calculus and Analytical Geometry
Trigonometry
Mathematical Physics
Complex analysis
Vector spaces
Bayes Theorem
Distributions
T distribution
Difference in means
Sampling distribution
Chi-square
Hypothesis Testing
T Paired tests
Confidence intervals
Regression Analysis
All kinds of probability
My services will be in the form of:
· Handwritten file
· Word file
· Step-by-step complete solution
· 100% accurate answer
0 Reviews
10+ Question Solved
Related Book For 

Elementary Statistics A Step By Step Approach
ISBN: 9780077665807
9th Edition
Authors: Allan G. Bluman
Question Posted:
